Immigrants from Ecuador vs Swiss 3 or more Vehicles in Household
COMPARE
Immigrants from Ecuador
Swiss
3 or more Vehicles in Household
3 or more Vehicles in Household Comparison
Immigrants from Ecuador
Swiss
13.4%
3 OR MORE VEHICLES IN HOUSEHOLD
0.0/ 100
METRIC RATING
334th/ 347
METRIC RANK
23.0%
3 OR MORE VEHICLES IN HOUSEHOLD
100.0/ 100
METRIC RATING
34th/ 347
METRIC RANK
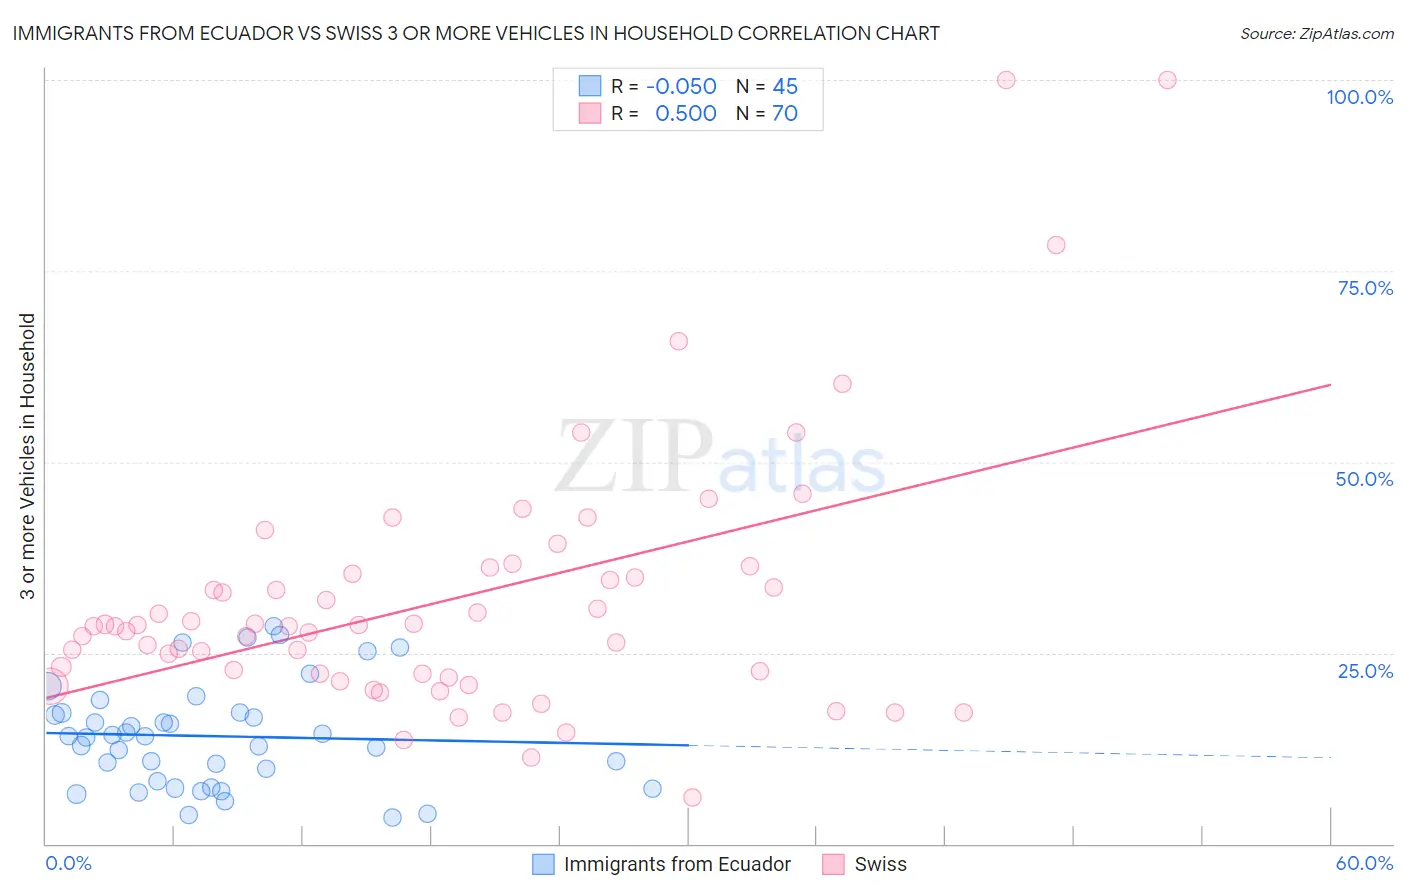
Immigrants from Ecuador vs Swiss 3 or more Vehicles in Household Correlation Chart
The statistical analysis conducted on geographies consisting of 270,830,512 people shows a slight negative correlation between the proportion of Immigrants from Ecuador and percentage of households with 3 or more vehicles available in the United States with a correlation coefficient (R) of -0.050 and weighted average of 13.4%. Similarly, the statistical analysis conducted on geographies consisting of 464,647,007 people shows a moderate positive correlation between the proportion of Swiss and percentage of households with 3 or more vehicles available in the United States with a correlation coefficient (R) of 0.500 and weighted average of 23.0%, a difference of 71.7%.
3 or more Vehicles in Household Correlation Summary
| Measurement | Immigrants from Ecuador | Swiss |
| Minimum | 3.4% | 6.1% |
| Maximum | 28.5% | 100.0% |
| Range | 25.0% | 93.9% |
| Mean | 14.1% | 31.9% |
| Median | 14.1% | 28.5% |
| Interquartile 25% (IQ1) | 7.8% | 22.3% |
| Interquartile 75% (IQ3) | 17.2% | 35.4% |
| Interquartile Range (IQR) | 9.4% | 13.1% |
| Standard Deviation (Sample) | 6.8% | 17.1% |
| Standard Deviation (Population) | 6.7% | 17.0% |
Similar Demographics by 3 or more Vehicles in Household
Demographics Similar to Immigrants from Ecuador by 3 or more Vehicles in Household
In terms of 3 or more vehicles in household, the demographic groups most similar to Immigrants from Ecuador are Immigrants from Trinidad and Tobago (13.3%, a difference of 0.46%), Immigrants from Cabo Verde (13.6%, a difference of 1.3%), Trinidadian and Tobagonian (13.6%, a difference of 1.6%), Immigrants from Dominica (13.7%, a difference of 2.4%), and West Indian (13.7%, a difference of 2.6%).
| Demographics | Rating | Rank | 3 or more Vehicles in Household |
| Ecuadorians | 0.0 /100 | #327 | Tragic 14.1% |
| Immigrants | Albania | 0.0 /100 | #328 | Tragic 14.0% |
| Immigrants | Senegal | 0.0 /100 | #329 | Tragic 13.8% |
| West Indians | 0.0 /100 | #330 | Tragic 13.7% |
| Immigrants | Dominica | 0.0 /100 | #331 | Tragic 13.7% |
| Trinidadians and Tobagonians | 0.0 /100 | #332 | Tragic 13.6% |
| Immigrants | Cabo Verde | 0.0 /100 | #333 | Tragic 13.6% |
| Immigrants | Ecuador | 0.0 /100 | #334 | Tragic 13.4% |
| Immigrants | Trinidad and Tobago | 0.0 /100 | #335 | Tragic 13.3% |
| Barbadians | 0.0 /100 | #336 | Tragic 12.6% |
| Immigrants | Bangladesh | 0.0 /100 | #337 | Tragic 12.5% |
| Vietnamese | 0.0 /100 | #338 | Tragic 12.5% |
| Immigrants | Uzbekistan | 0.0 /100 | #339 | Tragic 12.0% |
| Immigrants | Barbados | 0.0 /100 | #340 | Tragic 11.7% |
| Guyanese | 0.0 /100 | #341 | Tragic 11.5% |
Demographics Similar to Swiss by 3 or more Vehicles in Household
In terms of 3 or more vehicles in household, the demographic groups most similar to Swiss are Choctaw (23.0%, a difference of 0.020%), Spanish American (23.0%, a difference of 0.050%), Cherokee (23.0%, a difference of 0.060%), Swedish (23.0%, a difference of 0.080%), and Pueblo (23.0%, a difference of 0.11%).
| Demographics | Rating | Rank | 3 or more Vehicles in Household |
| Guamanians/Chamorros | 100.0 /100 | #27 | Exceptional 23.2% |
| Lumbee | 100.0 /100 | #28 | Exceptional 23.1% |
| Spanish | 100.0 /100 | #29 | Exceptional 23.1% |
| Immigrants | South Eastern Asia | 100.0 /100 | #30 | Exceptional 23.1% |
| English | 100.0 /100 | #31 | Exceptional 23.1% |
| Pueblo | 100.0 /100 | #32 | Exceptional 23.0% |
| Spanish Americans | 100.0 /100 | #33 | Exceptional 23.0% |
| Swiss | 100.0 /100 | #34 | Exceptional 23.0% |
| Choctaw | 100.0 /100 | #35 | Exceptional 23.0% |
| Cherokee | 100.0 /100 | #36 | Exceptional 23.0% |
| Swedes | 100.0 /100 | #37 | Exceptional 23.0% |
| Dutch | 100.0 /100 | #38 | Exceptional 22.9% |
| Yaqui | 100.0 /100 | #39 | Exceptional 22.9% |
| Europeans | 100.0 /100 | #40 | Exceptional 22.9% |
| Germans | 100.0 /100 | #41 | Exceptional 22.7% |