Immigrants from Mexico vs Native/Alaskan 3 or more Vehicles in Household
COMPARE
Immigrants from Mexico
Native/Alaskan
3 or more Vehicles in Household
3 or more Vehicles in Household Comparison
Immigrants from Mexico
Natives/Alaskans
24.6%
3 OR MORE VEHICLES IN HOUSEHOLD
100.0/ 100
METRIC RATING
14th/ 347
METRIC RANK
22.7%
3 OR MORE VEHICLES IN HOUSEHOLD
100.0/ 100
METRIC RATING
42nd/ 347
METRIC RANK
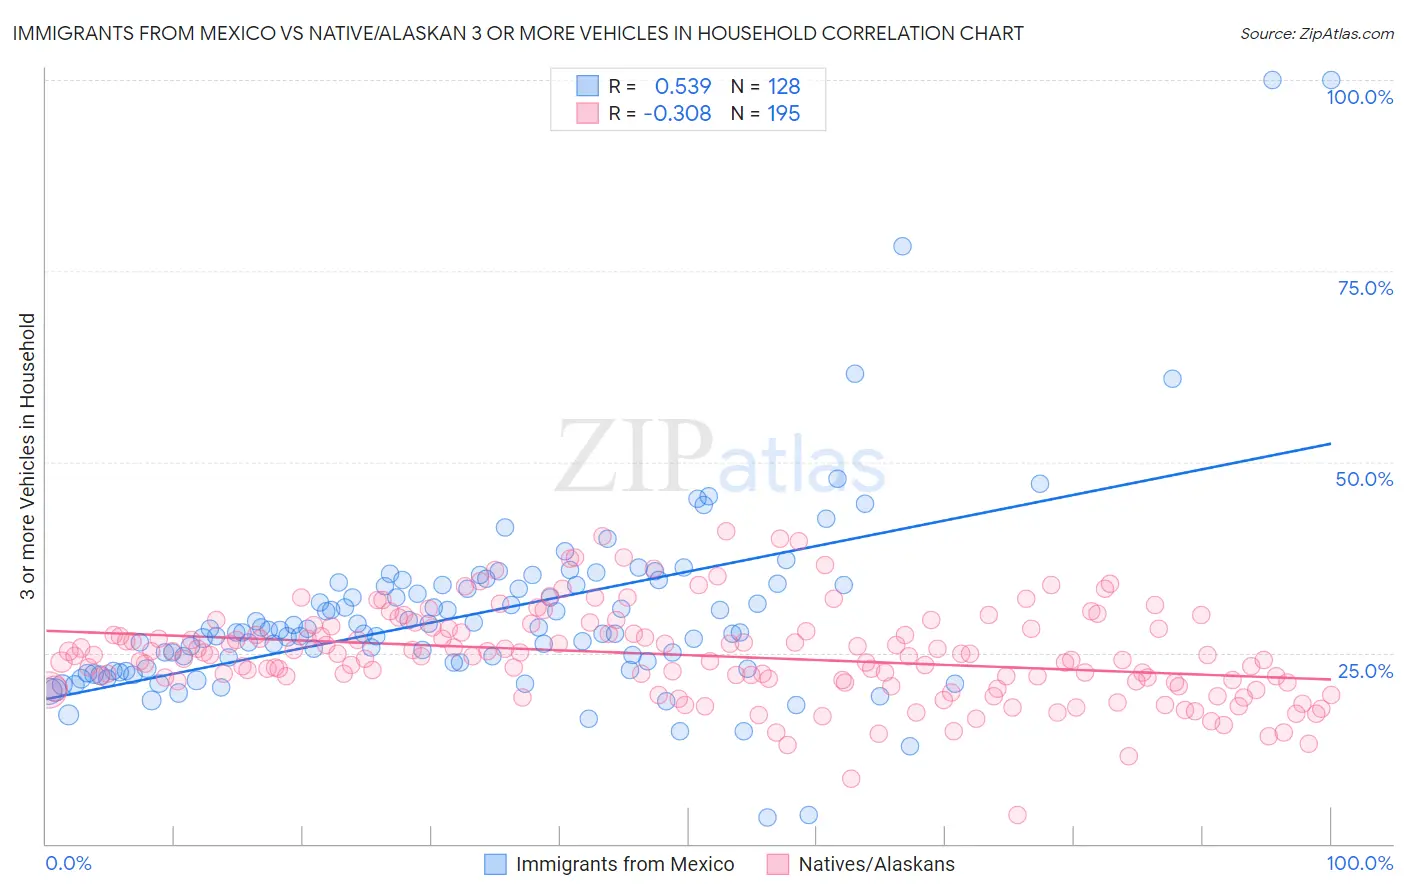
Immigrants from Mexico vs Native/Alaskan 3 or more Vehicles in Household Correlation Chart
The statistical analysis conducted on geographies consisting of 513,239,841 people shows a substantial positive correlation between the proportion of Immigrants from Mexico and percentage of households with 3 or more vehicles available in the United States with a correlation coefficient (R) of 0.539 and weighted average of 24.6%. Similarly, the statistical analysis conducted on geographies consisting of 512,441,086 people shows a mild negative correlation between the proportion of Natives/Alaskans and percentage of households with 3 or more vehicles available in the United States with a correlation coefficient (R) of -0.308 and weighted average of 22.7%, a difference of 8.1%.
3 or more Vehicles in Household Correlation Summary
| Measurement | Immigrants from Mexico | Native/Alaskan |
| Minimum | 3.4% | 3.7% |
| Maximum | 100.0% | 40.9% |
| Range | 96.6% | 37.2% |
| Mean | 30.1% | 24.7% |
| Median | 27.7% | 24.6% |
| Interquartile 25% (IQ1) | 22.9% | 21.2% |
| Interquartile 75% (IQ3) | 33.9% | 28.1% |
| Interquartile Range (IQR) | 11.0% | 6.9% |
| Standard Deviation (Sample) | 13.1% | 6.0% |
| Standard Deviation (Population) | 13.0% | 6.0% |
Similar Demographics by 3 or more Vehicles in Household
Demographics Similar to Immigrants from Mexico by 3 or more Vehicles in Household
In terms of 3 or more vehicles in household, the demographic groups most similar to Immigrants from Mexico are Mexican (24.7%, a difference of 0.44%), Danish (24.7%, a difference of 0.52%), Shoshone (24.9%, a difference of 1.2%), Nepalese (24.9%, a difference of 1.3%), and Hawaiian (24.3%, a difference of 1.4%).
| Demographics | Rating | Rank | 3 or more Vehicles in Household |
| Colville | 100.0 /100 | #7 | Exceptional 25.8% |
| Samoans | 100.0 /100 | #8 | Exceptional 25.0% |
| Native Hawaiians | 100.0 /100 | #9 | Exceptional 24.9% |
| Nepalese | 100.0 /100 | #10 | Exceptional 24.9% |
| Shoshone | 100.0 /100 | #11 | Exceptional 24.9% |
| Danes | 100.0 /100 | #12 | Exceptional 24.7% |
| Mexicans | 100.0 /100 | #13 | Exceptional 24.7% |
| Immigrants | Mexico | 100.0 /100 | #14 | Exceptional 24.6% |
| Hawaiians | 100.0 /100 | #15 | Exceptional 24.3% |
| Basques | 100.0 /100 | #16 | Exceptional 24.3% |
| Koreans | 100.0 /100 | #17 | Exceptional 24.1% |
| Norwegians | 100.0 /100 | #18 | Exceptional 23.9% |
| Chinese | 100.0 /100 | #19 | Exceptional 23.9% |
| Paiute | 100.0 /100 | #20 | Exceptional 23.8% |
| Immigrants | Vietnam | 100.0 /100 | #21 | Exceptional 23.8% |
Demographics Similar to Natives/Alaskans by 3 or more Vehicles in Household
In terms of 3 or more vehicles in household, the demographic groups most similar to Natives/Alaskans are German (22.7%, a difference of 0.0%), Osage (22.7%, a difference of 0.11%), Cheyenne (22.7%, a difference of 0.25%), Ute (22.7%, a difference of 0.35%), and European (22.9%, a difference of 0.47%).
| Demographics | Rating | Rank | 3 or more Vehicles in Household |
| Choctaw | 100.0 /100 | #35 | Exceptional 23.0% |
| Cherokee | 100.0 /100 | #36 | Exceptional 23.0% |
| Swedes | 100.0 /100 | #37 | Exceptional 23.0% |
| Dutch | 100.0 /100 | #38 | Exceptional 22.9% |
| Yaqui | 100.0 /100 | #39 | Exceptional 22.9% |
| Europeans | 100.0 /100 | #40 | Exceptional 22.9% |
| Germans | 100.0 /100 | #41 | Exceptional 22.7% |
| Natives/Alaskans | 100.0 /100 | #42 | Exceptional 22.7% |
| Osage | 100.0 /100 | #43 | Exceptional 22.7% |
| Cheyenne | 100.0 /100 | #44 | Exceptional 22.7% |
| Ute | 100.0 /100 | #45 | Exceptional 22.7% |
| Americans | 100.0 /100 | #46 | Exceptional 22.6% |
| Malaysians | 100.0 /100 | #47 | Exceptional 22.6% |
| Scottish | 100.0 /100 | #48 | Exceptional 22.6% |
| Scotch-Irish | 100.0 /100 | #49 | Exceptional 22.6% |