Immigrants from Moldova vs Native/Alaskan 3 or more Vehicles in Household
COMPARE
Immigrants from Moldova
Native/Alaskan
3 or more Vehicles in Household
3 or more Vehicles in Household Comparison
Immigrants from Moldova
Natives/Alaskans
19.1%
3 OR MORE VEHICLES IN HOUSEHOLD
23.6/ 100
METRIC RATING
195th/ 347
METRIC RANK
22.7%
3 OR MORE VEHICLES IN HOUSEHOLD
100.0/ 100
METRIC RATING
42nd/ 347
METRIC RANK
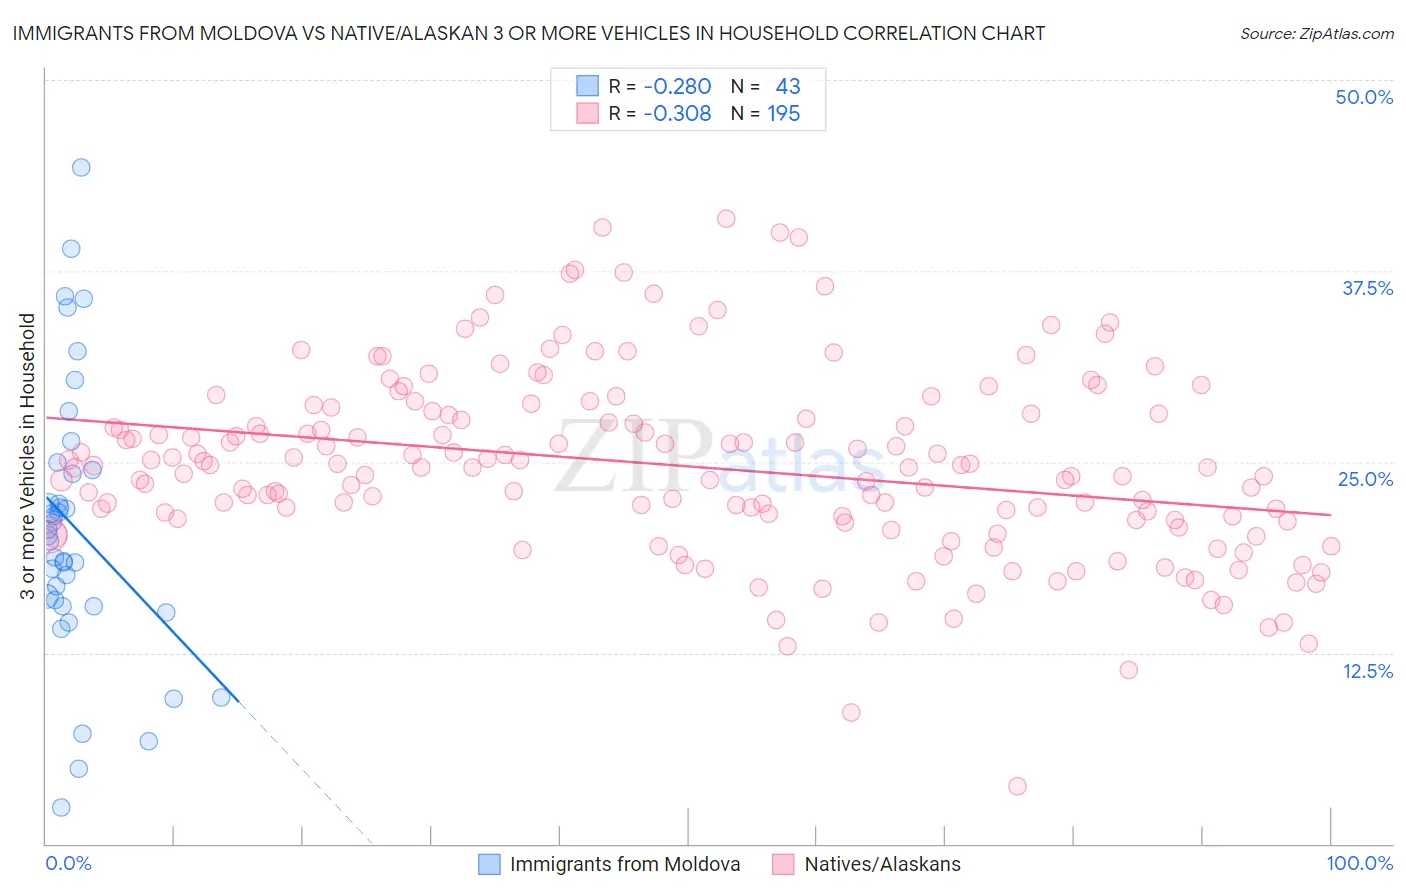
Immigrants from Moldova vs Native/Alaskan 3 or more Vehicles in Household Correlation Chart
The statistical analysis conducted on geographies consisting of 124,372,944 people shows a weak negative correlation between the proportion of Immigrants from Moldova and percentage of households with 3 or more vehicles available in the United States with a correlation coefficient (R) of -0.280 and weighted average of 19.1%. Similarly, the statistical analysis conducted on geographies consisting of 512,441,086 people shows a mild negative correlation between the proportion of Natives/Alaskans and percentage of households with 3 or more vehicles available in the United States with a correlation coefficient (R) of -0.308 and weighted average of 22.7%, a difference of 19.3%.
3 or more Vehicles in Household Correlation Summary
| Measurement | Immigrants from Moldova | Native/Alaskan |
| Minimum | 2.4% | 3.7% |
| Maximum | 44.3% | 40.9% |
| Range | 41.9% | 37.2% |
| Mean | 20.7% | 24.7% |
| Median | 20.2% | 24.6% |
| Interquartile 25% (IQ1) | 15.5% | 21.2% |
| Interquartile 75% (IQ3) | 24.5% | 28.1% |
| Interquartile Range (IQR) | 8.9% | 6.9% |
| Standard Deviation (Sample) | 9.0% | 6.0% |
| Standard Deviation (Population) | 8.9% | 6.0% |
Similar Demographics by 3 or more Vehicles in Household
Demographics Similar to Immigrants from Moldova by 3 or more Vehicles in Household
In terms of 3 or more vehicles in household, the demographic groups most similar to Immigrants from Moldova are Serbian (19.1%, a difference of 0.040%), Tsimshian (19.1%, a difference of 0.080%), Kenyan (19.1%, a difference of 0.11%), Central American Indian (19.0%, a difference of 0.15%), and South American Indian (19.1%, a difference of 0.18%).
| Demographics | Rating | Rank | 3 or more Vehicles in Household |
| Immigrants | Kuwait | 26.1 /100 | #188 | Fair 19.1% |
| Indians (Asian) | 26.0 /100 | #189 | Fair 19.1% |
| Immigrants | Zimbabwe | 25.5 /100 | #190 | Fair 19.1% |
| South American Indians | 25.4 /100 | #191 | Fair 19.1% |
| Kenyans | 24.7 /100 | #192 | Fair 19.1% |
| Tsimshian | 24.4 /100 | #193 | Fair 19.1% |
| Serbians | 24.0 /100 | #194 | Fair 19.1% |
| Immigrants | Moldova | 23.6 /100 | #195 | Fair 19.1% |
| Central American Indians | 22.2 /100 | #196 | Fair 19.0% |
| Immigrants | Japan | 22.0 /100 | #197 | Fair 19.0% |
| Egyptians | 19.5 /100 | #198 | Poor 19.0% |
| Immigrants | Norway | 19.0 /100 | #199 | Poor 19.0% |
| Argentineans | 18.2 /100 | #200 | Poor 18.9% |
| Arabs | 17.7 /100 | #201 | Poor 18.9% |
| Immigrants | Austria | 15.4 /100 | #202 | Poor 18.9% |
Demographics Similar to Natives/Alaskans by 3 or more Vehicles in Household
In terms of 3 or more vehicles in household, the demographic groups most similar to Natives/Alaskans are German (22.7%, a difference of 0.0%), Osage (22.7%, a difference of 0.11%), Cheyenne (22.7%, a difference of 0.25%), Ute (22.7%, a difference of 0.35%), and European (22.9%, a difference of 0.47%).
| Demographics | Rating | Rank | 3 or more Vehicles in Household |
| Choctaw | 100.0 /100 | #35 | Exceptional 23.0% |
| Cherokee | 100.0 /100 | #36 | Exceptional 23.0% |
| Swedes | 100.0 /100 | #37 | Exceptional 23.0% |
| Dutch | 100.0 /100 | #38 | Exceptional 22.9% |
| Yaqui | 100.0 /100 | #39 | Exceptional 22.9% |
| Europeans | 100.0 /100 | #40 | Exceptional 22.9% |
| Germans | 100.0 /100 | #41 | Exceptional 22.7% |
| Natives/Alaskans | 100.0 /100 | #42 | Exceptional 22.7% |
| Osage | 100.0 /100 | #43 | Exceptional 22.7% |
| Cheyenne | 100.0 /100 | #44 | Exceptional 22.7% |
| Ute | 100.0 /100 | #45 | Exceptional 22.7% |
| Americans | 100.0 /100 | #46 | Exceptional 22.6% |
| Malaysians | 100.0 /100 | #47 | Exceptional 22.6% |
| Scottish | 100.0 /100 | #48 | Exceptional 22.6% |
| Scotch-Irish | 100.0 /100 | #49 | Exceptional 22.6% |