Immigrants from Ecuador vs Native/Alaskan Bachelor's Degree
COMPARE
Immigrants from Ecuador
Native/Alaskan
Bachelor's Degree
Bachelor's Degree Comparison
Immigrants from Ecuador
Natives/Alaskans
34.7%
BACHELOR'S DEGREE
3.3/ 100
METRIC RATING
233rd/ 347
METRIC RANK
26.3%
BACHELOR'S DEGREE
0.0/ 100
METRIC RATING
335th/ 347
METRIC RANK
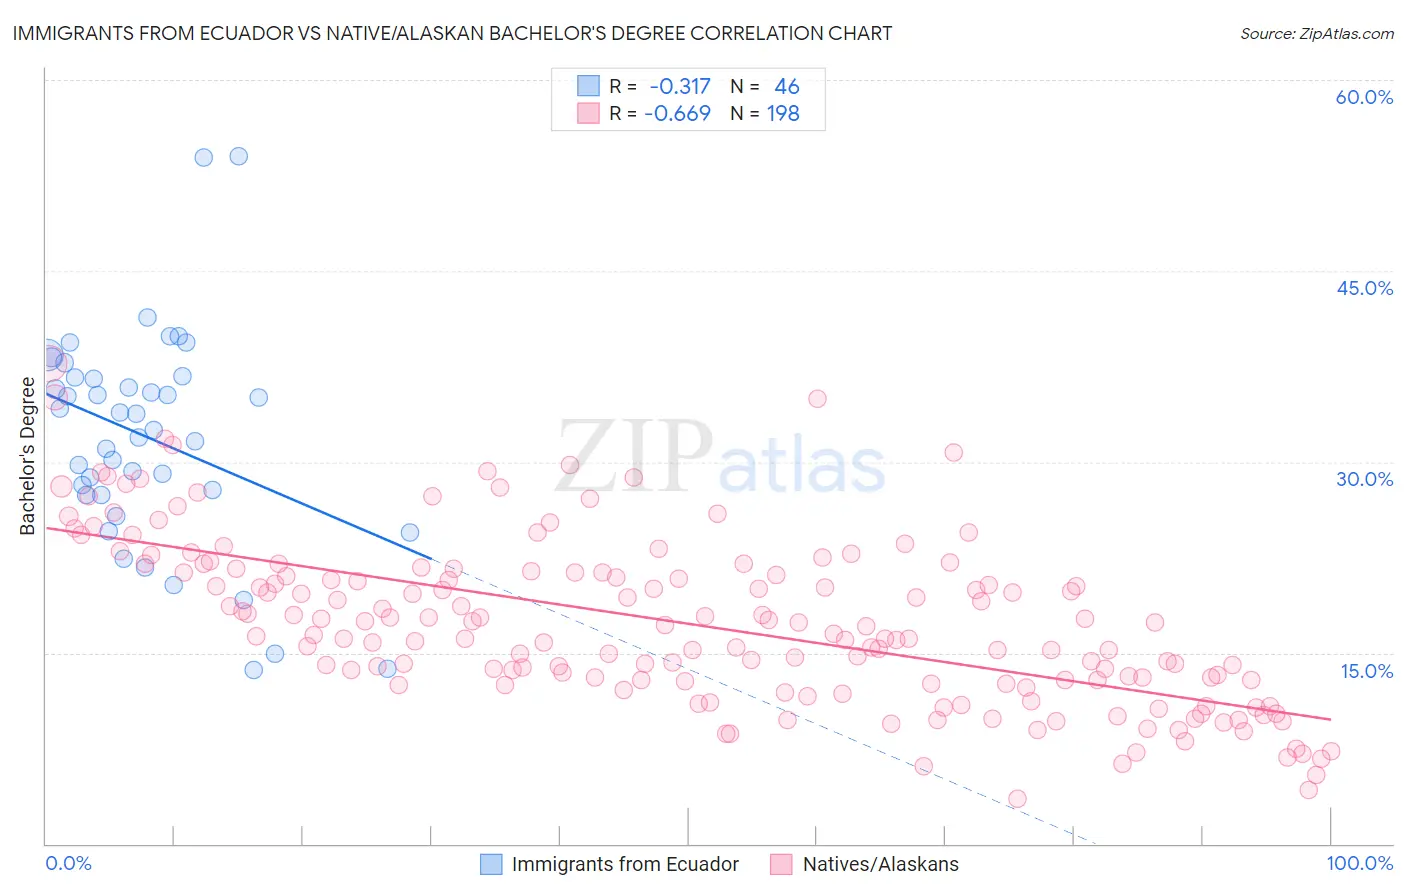
Immigrants from Ecuador vs Native/Alaskan Bachelor's Degree Correlation Chart
The statistical analysis conducted on geographies consisting of 271,013,109 people shows a mild negative correlation between the proportion of Immigrants from Ecuador and percentage of population with at least bachelor's degree education in the United States with a correlation coefficient (R) of -0.317 and weighted average of 34.7%. Similarly, the statistical analysis conducted on geographies consisting of 512,966,883 people shows a significant negative correlation between the proportion of Natives/Alaskans and percentage of population with at least bachelor's degree education in the United States with a correlation coefficient (R) of -0.669 and weighted average of 26.3%, a difference of 31.9%.
Bachelor's Degree Correlation Summary
| Measurement | Immigrants from Ecuador | Native/Alaskan |
| Minimum | 13.7% | 3.5% |
| Maximum | 54.0% | 37.7% |
| Range | 40.4% | 34.2% |
| Mean | 31.9% | 17.3% |
| Median | 33.1% | 16.5% |
| Interquartile 25% (IQ1) | 27.4% | 12.7% |
| Interquartile 75% (IQ3) | 36.6% | 21.3% |
| Interquartile Range (IQR) | 9.3% | 8.6% |
| Standard Deviation (Sample) | 8.5% | 6.5% |
| Standard Deviation (Population) | 8.4% | 6.5% |
Similar Demographics by Bachelor's Degree
Demographics Similar to Immigrants from Ecuador by Bachelor's Degree
In terms of bachelor's degree, the demographic groups most similar to Immigrants from Ecuador are Hmong (34.8%, a difference of 0.11%), Guamanian/Chamorro (34.6%, a difference of 0.22%), Immigrants from West Indies (34.6%, a difference of 0.31%), Liberian (34.6%, a difference of 0.42%), and Tlingit-Haida (34.6%, a difference of 0.45%).
| Demographics | Rating | Rank | Bachelor's Degree |
| Portuguese | 7.2 /100 | #226 | Tragic 35.5% |
| Ecuadorians | 6.6 /100 | #227 | Tragic 35.4% |
| Immigrants | Trinidad and Tobago | 6.0 /100 | #228 | Tragic 35.3% |
| Whites/Caucasians | 5.9 /100 | #229 | Tragic 35.3% |
| Immigrants | Grenada | 4.3 /100 | #230 | Tragic 35.0% |
| Immigrants | St. Vincent and the Grenadines | 4.3 /100 | #231 | Tragic 35.0% |
| Hmong | 3.4 /100 | #232 | Tragic 34.8% |
| Immigrants | Ecuador | 3.3 /100 | #233 | Tragic 34.7% |
| Guamanians/Chamorros | 3.0 /100 | #234 | Tragic 34.6% |
| Immigrants | West Indies | 2.9 /100 | #235 | Tragic 34.6% |
| Liberians | 2.8 /100 | #236 | Tragic 34.6% |
| Tlingit-Haida | 2.8 /100 | #237 | Tragic 34.6% |
| Guyanese | 2.5 /100 | #238 | Tragic 34.5% |
| British West Indians | 2.5 /100 | #239 | Tragic 34.5% |
| Tongans | 2.0 /100 | #240 | Tragic 34.3% |
Demographics Similar to Natives/Alaskans by Bachelor's Degree
In terms of bachelor's degree, the demographic groups most similar to Natives/Alaskans are Immigrants from Mexico (26.1%, a difference of 0.70%), Arapaho (26.6%, a difference of 1.1%), Inupiat (25.8%, a difference of 2.0%), Mexican (27.1%, a difference of 2.9%), and Pueblo (25.5%, a difference of 3.1%).
| Demographics | Rating | Rank | Bachelor's Degree |
| Crow | 0.0 /100 | #328 | Tragic 27.7% |
| Immigrants | Central America | 0.0 /100 | #329 | Tragic 27.5% |
| Spanish American Indians | 0.0 /100 | #330 | Tragic 27.5% |
| Immigrants | Azores | 0.0 /100 | #331 | Tragic 27.3% |
| Menominee | 0.0 /100 | #332 | Tragic 27.3% |
| Mexicans | 0.0 /100 | #333 | Tragic 27.1% |
| Arapaho | 0.0 /100 | #334 | Tragic 26.6% |
| Natives/Alaskans | 0.0 /100 | #335 | Tragic 26.3% |
| Immigrants | Mexico | 0.0 /100 | #336 | Tragic 26.1% |
| Inupiat | 0.0 /100 | #337 | Tragic 25.8% |
| Pueblo | 0.0 /100 | #338 | Tragic 25.5% |
| Hopi | 0.0 /100 | #339 | Tragic 25.3% |
| Lumbee | 0.0 /100 | #340 | Tragic 24.8% |
| Yuman | 0.0 /100 | #341 | Tragic 24.5% |
| Yakama | 0.0 /100 | #342 | Tragic 24.5% |