Immigrants from Eastern Asia vs Moroccan Poverty
COMPARE
Immigrants from Eastern Asia
Moroccan
Poverty
Poverty Comparison
Immigrants from Eastern Asia
Moroccans
11.3%
POVERTY
96.7/ 100
METRIC RATING
77th/ 347
METRIC RANK
13.2%
POVERTY
5.2/ 100
METRIC RATING
211th/ 347
METRIC RANK
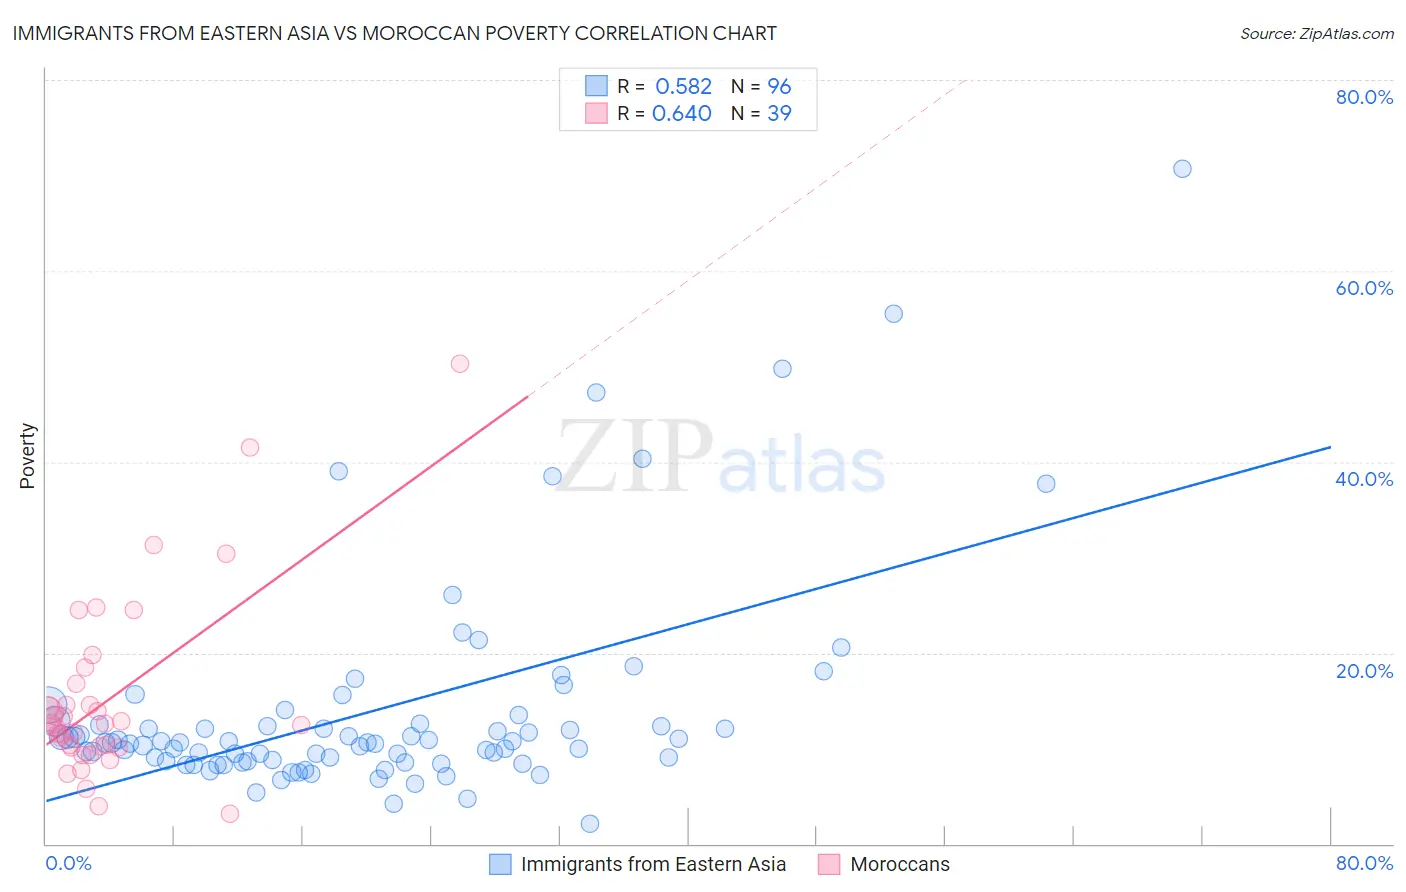
Immigrants from Eastern Asia vs Moroccan Poverty Correlation Chart
The statistical analysis conducted on geographies consisting of 499,367,398 people shows a substantial positive correlation between the proportion of Immigrants from Eastern Asia and poverty level in the United States with a correlation coefficient (R) of 0.582 and weighted average of 11.3%. Similarly, the statistical analysis conducted on geographies consisting of 201,757,500 people shows a significant positive correlation between the proportion of Moroccans and poverty level in the United States with a correlation coefficient (R) of 0.640 and weighted average of 13.2%, a difference of 16.6%.
Poverty Correlation Summary
| Measurement | Immigrants from Eastern Asia | Moroccan |
| Minimum | 2.1% | 3.2% |
| Maximum | 70.7% | 50.3% |
| Range | 68.7% | 47.1% |
| Mean | 13.9% | 15.3% |
| Median | 10.6% | 12.5% |
| Interquartile 25% (IQ1) | 8.6% | 10.1% |
| Interquartile 75% (IQ3) | 12.5% | 16.7% |
| Interquartile Range (IQR) | 3.8% | 6.6% |
| Standard Deviation (Sample) | 11.2% | 9.6% |
| Standard Deviation (Population) | 11.2% | 9.5% |
Similar Demographics by Poverty
Demographics Similar to Immigrants from Eastern Asia by Poverty
In terms of poverty, the demographic groups most similar to Immigrants from Eastern Asia are Dutch (11.3%, a difference of 0.010%), Cambodian (11.3%, a difference of 0.060%), Immigrants from North America (11.3%, a difference of 0.070%), Indian (Asian) (11.3%, a difference of 0.080%), and Irish (11.3%, a difference of 0.080%).
| Demographics | Rating | Rank | Poverty |
| Immigrants | Canada | 97.3 /100 | #70 | Exceptional 11.3% |
| Zimbabweans | 97.3 /100 | #71 | Exceptional 11.3% |
| Europeans | 97.2 /100 | #72 | Exceptional 11.3% |
| Immigrants | Belgium | 97.2 /100 | #73 | Exceptional 11.3% |
| Carpatho Rusyns | 97.2 /100 | #74 | Exceptional 11.3% |
| Immigrants | Eastern Europe | 97.0 /100 | #75 | Exceptional 11.3% |
| Immigrants | North America | 96.8 /100 | #76 | Exceptional 11.3% |
| Immigrants | Eastern Asia | 96.7 /100 | #77 | Exceptional 11.3% |
| Dutch | 96.7 /100 | #78 | Exceptional 11.3% |
| Cambodians | 96.7 /100 | #79 | Exceptional 11.3% |
| Indians (Asian) | 96.6 /100 | #80 | Exceptional 11.3% |
| Irish | 96.6 /100 | #81 | Exceptional 11.3% |
| Egyptians | 96.5 /100 | #82 | Exceptional 11.3% |
| Immigrants | Sweden | 96.3 /100 | #83 | Exceptional 11.3% |
| English | 96.3 /100 | #84 | Exceptional 11.3% |
Demographics Similar to Moroccans by Poverty
In terms of poverty, the demographic groups most similar to Moroccans are Immigrants from the Azores (13.1%, a difference of 0.35%), Malaysian (13.1%, a difference of 0.38%), Ugandan (13.1%, a difference of 0.42%), Immigrants (13.2%, a difference of 0.45%), and Panamanian (13.1%, a difference of 0.57%).
| Demographics | Rating | Rank | Poverty |
| Immigrants | Western Asia | 14.1 /100 | #204 | Poor 12.9% |
| Tsimshian | 9.2 /100 | #205 | Tragic 13.0% |
| Immigrants | Eastern Africa | 7.0 /100 | #206 | Tragic 13.1% |
| Panamanians | 6.6 /100 | #207 | Tragic 13.1% |
| Ugandans | 6.2 /100 | #208 | Tragic 13.1% |
| Malaysians | 6.1 /100 | #209 | Tragic 13.1% |
| Immigrants | Azores | 6.1 /100 | #210 | Tragic 13.1% |
| Moroccans | 5.2 /100 | #211 | Tragic 13.2% |
| Immigrants | Immigrants | 4.3 /100 | #212 | Tragic 13.2% |
| Immigrants | Panama | 4.1 /100 | #213 | Tragic 13.3% |
| Bermudans | 3.7 /100 | #214 | Tragic 13.3% |
| Japanese | 3.3 /100 | #215 | Tragic 13.3% |
| Immigrants | Nonimmigrants | 3.3 /100 | #216 | Tragic 13.3% |
| Immigrants | Uzbekistan | 3.2 /100 | #217 | Tragic 13.3% |
| Immigrants | Thailand | 3.1 /100 | #218 | Tragic 13.3% |