Immigrants from China vs Immigrants from Middle Africa 2 or more Vehicles in Household
COMPARE
Immigrants from China
Immigrants from Middle Africa
2 or more Vehicles in Household
2 or more Vehicles in Household Comparison
Immigrants from China
Immigrants from Middle Africa
51.5%
2 OR MORE VEHICLES IN HOUSEHOLD
0.1/ 100
METRIC RATING
283rd/ 347
METRIC RANK
53.4%
2 OR MORE VEHICLES IN HOUSEHOLD
3.0/ 100
METRIC RATING
235th/ 347
METRIC RANK
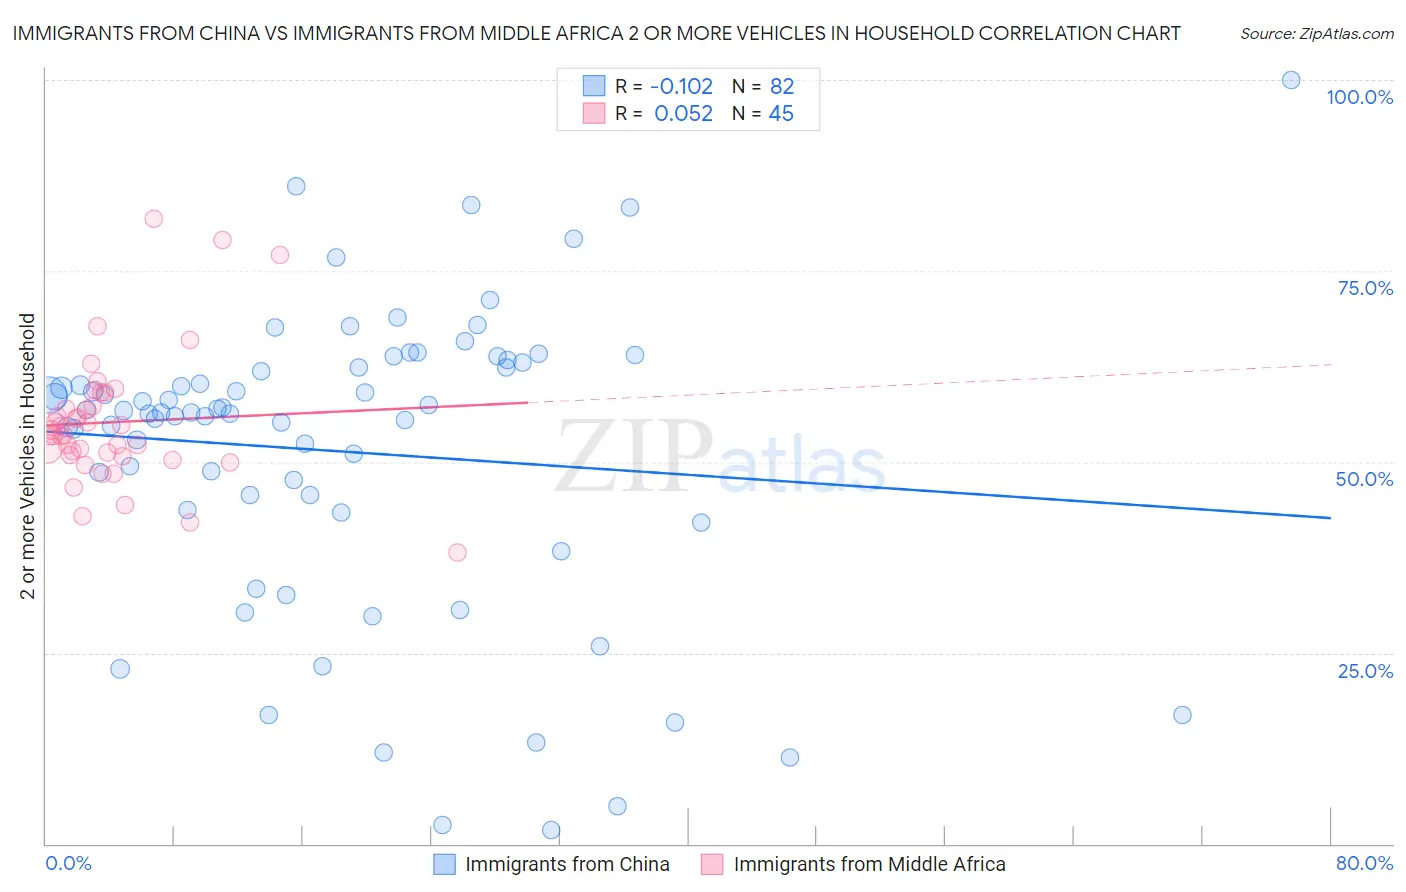
Immigrants from China vs Immigrants from Middle Africa 2 or more Vehicles in Household Correlation Chart
The statistical analysis conducted on geographies consisting of 456,653,967 people shows a poor negative correlation between the proportion of Immigrants from China and percentage of households with 2 or more vehicles available in the United States with a correlation coefficient (R) of -0.102 and weighted average of 51.5%. Similarly, the statistical analysis conducted on geographies consisting of 202,671,217 people shows a slight positive correlation between the proportion of Immigrants from Middle Africa and percentage of households with 2 or more vehicles available in the United States with a correlation coefficient (R) of 0.052 and weighted average of 53.4%, a difference of 3.8%.
2 or more Vehicles in Household Correlation Summary
| Measurement | Immigrants from China | Immigrants from Middle Africa |
| Minimum | 1.8% | 38.1% |
| Maximum | 100.0% | 81.8% |
| Range | 98.2% | 43.7% |
| Mean | 51.4% | 55.2% |
| Median | 56.4% | 53.5% |
| Interquartile 25% (IQ1) | 43.8% | 50.8% |
| Interquartile 75% (IQ3) | 62.3% | 58.1% |
| Interquartile Range (IQR) | 18.6% | 7.4% |
| Standard Deviation (Sample) | 19.7% | 8.7% |
| Standard Deviation (Population) | 19.6% | 8.6% |
Similar Demographics by 2 or more Vehicles in Household
Demographics Similar to Immigrants from China by 2 or more Vehicles in Household
In terms of 2 or more vehicles in household, the demographic groups most similar to Immigrants from China are Immigrants from Zaire (51.5%, a difference of 0.040%), Bahamian (51.5%, a difference of 0.080%), Immigrants from Kazakhstan (51.6%, a difference of 0.14%), Immigrants from Uruguay (51.4%, a difference of 0.20%), and Immigrants from Liberia (51.3%, a difference of 0.34%).
| Demographics | Rating | Rank | 2 or more Vehicles in Household |
| Immigrants | Croatia | 0.2 /100 | #276 | Tragic 51.8% |
| Immigrants | Africa | 0.2 /100 | #277 | Tragic 51.8% |
| Yuman | 0.1 /100 | #278 | Tragic 51.7% |
| Liberians | 0.1 /100 | #279 | Tragic 51.7% |
| Immigrants | Eastern Europe | 0.1 /100 | #280 | Tragic 51.7% |
| Immigrants | Kazakhstan | 0.1 /100 | #281 | Tragic 51.6% |
| Bahamians | 0.1 /100 | #282 | Tragic 51.5% |
| Immigrants | China | 0.1 /100 | #283 | Tragic 51.5% |
| Immigrants | Zaire | 0.1 /100 | #284 | Tragic 51.5% |
| Immigrants | Uruguay | 0.1 /100 | #285 | Tragic 51.4% |
| Immigrants | Liberia | 0.1 /100 | #286 | Tragic 51.3% |
| Immigrants | Serbia | 0.1 /100 | #287 | Tragic 51.3% |
| Okinawans | 0.1 /100 | #288 | Tragic 51.2% |
| Somalis | 0.0 /100 | #289 | Tragic 51.1% |
| Immigrants | Panama | 0.0 /100 | #290 | Tragic 51.1% |
Demographics Similar to Immigrants from Middle Africa by 2 or more Vehicles in Household
In terms of 2 or more vehicles in household, the demographic groups most similar to Immigrants from Middle Africa are Immigrants from Switzerland (53.4%, a difference of 0.030%), Immigrants from Guatemala (53.5%, a difference of 0.090%), Ugandan (53.5%, a difference of 0.090%), Indonesian (53.4%, a difference of 0.10%), and Panamanian (53.5%, a difference of 0.16%).
| Demographics | Rating | Rank | 2 or more Vehicles in Household |
| Alaska Natives | 3.9 /100 | #228 | Tragic 53.6% |
| Immigrants | Turkey | 3.8 /100 | #229 | Tragic 53.6% |
| Immigrants | Nepal | 3.6 /100 | #230 | Tragic 53.5% |
| Panamanians | 3.4 /100 | #231 | Tragic 53.5% |
| Immigrants | Guatemala | 3.2 /100 | #232 | Tragic 53.5% |
| Ugandans | 3.2 /100 | #233 | Tragic 53.5% |
| Immigrants | Switzerland | 3.0 /100 | #234 | Tragic 53.4% |
| Immigrants | Middle Africa | 3.0 /100 | #235 | Tragic 53.4% |
| Indonesians | 2.7 /100 | #236 | Tragic 53.4% |
| Macedonians | 2.4 /100 | #237 | Tragic 53.3% |
| Immigrants | Armenia | 2.3 /100 | #238 | Tragic 53.3% |
| Cambodians | 2.3 /100 | #239 | Tragic 53.3% |
| Immigrants | Europe | 2.1 /100 | #240 | Tragic 53.2% |
| Immigrants | Sierra Leone | 2.1 /100 | #241 | Tragic 53.2% |
| Immigrants | Eastern Asia | 2.1 /100 | #242 | Tragic 53.2% |