Tohono O'odham vs Immigrants from Middle Africa 2 or more Vehicles in Household
COMPARE
Tohono O'odham
Immigrants from Middle Africa
2 or more Vehicles in Household
2 or more Vehicles in Household Comparison
Tohono O'odham
Immigrants from Middle Africa
50.0%
2 OR MORE VEHICLES IN HOUSEHOLD
0.0/ 100
METRIC RATING
303rd/ 347
METRIC RANK
53.4%
2 OR MORE VEHICLES IN HOUSEHOLD
3.0/ 100
METRIC RATING
235th/ 347
METRIC RANK
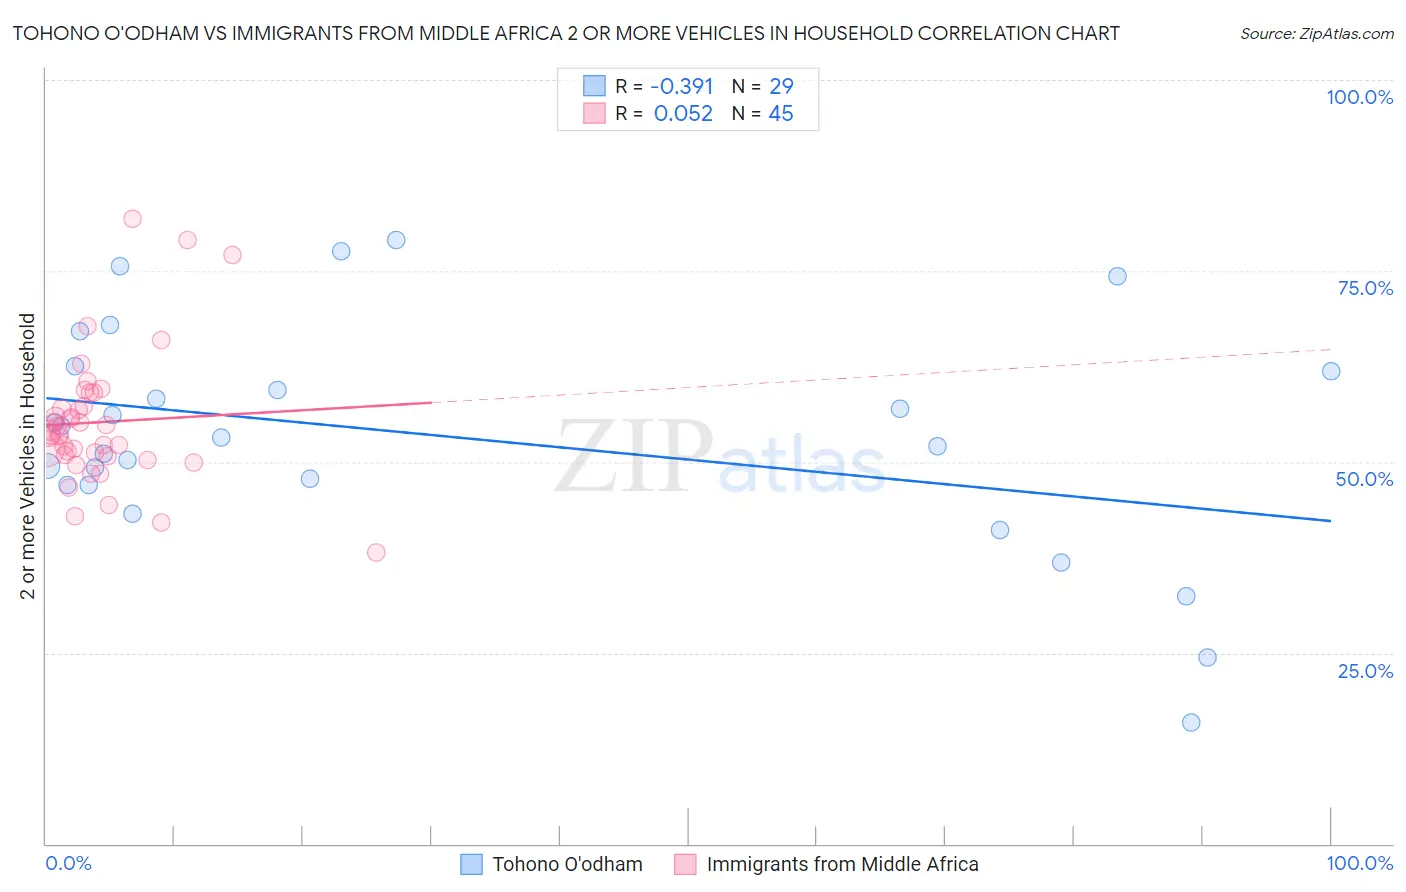
Tohono O'odham vs Immigrants from Middle Africa 2 or more Vehicles in Household Correlation Chart
The statistical analysis conducted on geographies consisting of 58,718,439 people shows a mild negative correlation between the proportion of Tohono O'odham and percentage of households with 2 or more vehicles available in the United States with a correlation coefficient (R) of -0.391 and weighted average of 50.0%. Similarly, the statistical analysis conducted on geographies consisting of 202,671,217 people shows a slight positive correlation between the proportion of Immigrants from Middle Africa and percentage of households with 2 or more vehicles available in the United States with a correlation coefficient (R) of 0.052 and weighted average of 53.4%, a difference of 6.9%.
2 or more Vehicles in Household Correlation Summary
| Measurement | Tohono O'odham | Immigrants from Middle Africa |
| Minimum | 15.9% | 38.1% |
| Maximum | 79.0% | 81.8% |
| Range | 63.1% | 43.7% |
| Mean | 53.3% | 55.2% |
| Median | 53.2% | 53.5% |
| Interquartile 25% (IQ1) | 47.0% | 50.8% |
| Interquartile 75% (IQ3) | 62.2% | 58.1% |
| Interquartile Range (IQR) | 15.3% | 7.4% |
| Standard Deviation (Sample) | 14.9% | 8.7% |
| Standard Deviation (Population) | 14.6% | 8.6% |
Similar Demographics by 2 or more Vehicles in Household
Demographics Similar to Tohono O'odham by 2 or more Vehicles in Household
In terms of 2 or more vehicles in household, the demographic groups most similar to Tohono O'odham are Immigrants from Belize (49.9%, a difference of 0.20%), Immigrants from South America (50.2%, a difference of 0.37%), Immigrants from Greece (50.2%, a difference of 0.43%), Immigrants from Russia (50.3%, a difference of 0.62%), and Immigrants from Morocco (50.3%, a difference of 0.65%).
| Demographics | Rating | Rank | 2 or more Vehicles in Household |
| Immigrants | Somalia | 0.0 /100 | #296 | Tragic 50.5% |
| Immigrants | Spain | 0.0 /100 | #297 | Tragic 50.4% |
| Paraguayans | 0.0 /100 | #298 | Tragic 50.3% |
| Immigrants | Morocco | 0.0 /100 | #299 | Tragic 50.3% |
| Immigrants | Russia | 0.0 /100 | #300 | Tragic 50.3% |
| Immigrants | Greece | 0.0 /100 | #301 | Tragic 50.2% |
| Immigrants | South America | 0.0 /100 | #302 | Tragic 50.2% |
| Tohono O'odham | 0.0 /100 | #303 | Tragic 50.0% |
| Immigrants | Belize | 0.0 /100 | #304 | Tragic 49.9% |
| Immigrants | Western Africa | 0.0 /100 | #305 | Tragic 49.4% |
| Immigrants | Israel | 0.0 /100 | #306 | Tragic 49.2% |
| Hopi | 0.0 /100 | #307 | Tragic 49.0% |
| Albanians | 0.0 /100 | #308 | Tragic 49.0% |
| Moroccans | 0.0 /100 | #309 | Tragic 48.8% |
| Ghanaians | 0.0 /100 | #310 | Tragic 48.0% |
Demographics Similar to Immigrants from Middle Africa by 2 or more Vehicles in Household
In terms of 2 or more vehicles in household, the demographic groups most similar to Immigrants from Middle Africa are Immigrants from Switzerland (53.4%, a difference of 0.030%), Immigrants from Guatemala (53.5%, a difference of 0.090%), Ugandan (53.5%, a difference of 0.090%), Indonesian (53.4%, a difference of 0.10%), and Panamanian (53.5%, a difference of 0.16%).
| Demographics | Rating | Rank | 2 or more Vehicles in Household |
| Alaska Natives | 3.9 /100 | #228 | Tragic 53.6% |
| Immigrants | Turkey | 3.8 /100 | #229 | Tragic 53.6% |
| Immigrants | Nepal | 3.6 /100 | #230 | Tragic 53.5% |
| Panamanians | 3.4 /100 | #231 | Tragic 53.5% |
| Immigrants | Guatemala | 3.2 /100 | #232 | Tragic 53.5% |
| Ugandans | 3.2 /100 | #233 | Tragic 53.5% |
| Immigrants | Switzerland | 3.0 /100 | #234 | Tragic 53.4% |
| Immigrants | Middle Africa | 3.0 /100 | #235 | Tragic 53.4% |
| Indonesians | 2.7 /100 | #236 | Tragic 53.4% |
| Macedonians | 2.4 /100 | #237 | Tragic 53.3% |
| Immigrants | Armenia | 2.3 /100 | #238 | Tragic 53.3% |
| Cambodians | 2.3 /100 | #239 | Tragic 53.3% |
| Immigrants | Europe | 2.1 /100 | #240 | Tragic 53.2% |
| Immigrants | Sierra Leone | 2.1 /100 | #241 | Tragic 53.2% |
| Immigrants | Eastern Asia | 2.1 /100 | #242 | Tragic 53.2% |