Immigrants from China vs Immigrants from Caribbean 2 or more Vehicles in Household
COMPARE
Immigrants from China
Immigrants from Caribbean
2 or more Vehicles in Household
2 or more Vehicles in Household Comparison
Immigrants from China
Immigrants from Caribbean
51.5%
2 OR MORE VEHICLES IN HOUSEHOLD
0.1/ 100
METRIC RATING
283rd/ 347
METRIC RANK
44.2%
2 OR MORE VEHICLES IN HOUSEHOLD
0.0/ 100
METRIC RATING
323rd/ 347
METRIC RANK
Immigrants from China vs Immigrants from Caribbean 2 or more Vehicles in Household Correlation Chart
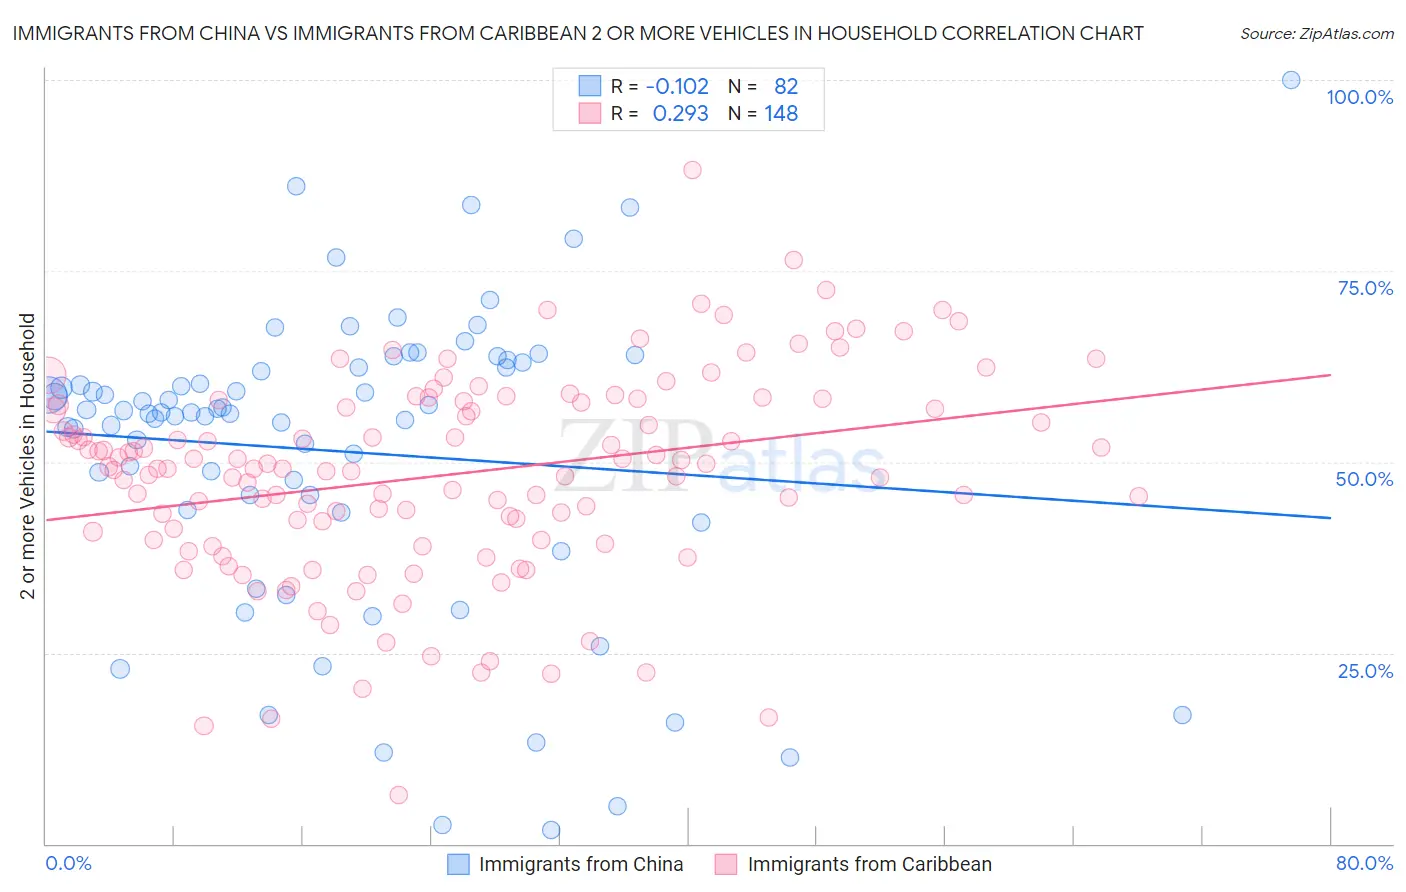
The statistical analysis conducted on geographies consisting of 456,653,967 people shows a poor negative correlation between the proportion of Immigrants from China and percentage of households with 2 or more vehicles available in the United States with a correlation coefficient (R) of -0.102 and weighted average of 51.5%. Similarly, the statistical analysis conducted on geographies consisting of 449,714,597 people shows a weak positive correlation between the proportion of Immigrants from Caribbean and percentage of households with 2 or more vehicles available in the United States with a correlation coefficient (R) of 0.293 and weighted average of 44.2%, a difference of 16.4%.
2 or more Vehicles in Household Correlation Summary
| Measurement | Immigrants from China | Immigrants from Caribbean |
| Minimum | 1.8% | 6.4% |
| Maximum | 100.0% | 88.2% |
| Range | 98.2% | 81.8% |
| Mean | 51.4% | 48.3% |
| Median | 56.4% | 49.1% |
| Interquartile 25% (IQ1) | 43.8% | 40.3% |
| Interquartile 75% (IQ3) | 62.3% | 57.6% |
| Interquartile Range (IQR) | 18.6% | 17.3% |
| Standard Deviation (Sample) | 19.7% | 13.3% |
| Standard Deviation (Population) | 19.6% | 13.3% |
Similar Demographics by 2 or more Vehicles in Household
Demographics Similar to Immigrants from China by 2 or more Vehicles in Household
In terms of 2 or more vehicles in household, the demographic groups most similar to Immigrants from China are Immigrants from Zaire (51.5%, a difference of 0.040%), Bahamian (51.5%, a difference of 0.080%), Immigrants from Kazakhstan (51.6%, a difference of 0.14%), Immigrants from Uruguay (51.4%, a difference of 0.20%), and Immigrants from Liberia (51.3%, a difference of 0.34%).
| Demographics | Rating | Rank | 2 or more Vehicles in Household |
| Immigrants | Croatia | 0.2 /100 | #276 | Tragic 51.8% |
| Immigrants | Africa | 0.2 /100 | #277 | Tragic 51.8% |
| Yuman | 0.1 /100 | #278 | Tragic 51.7% |
| Liberians | 0.1 /100 | #279 | Tragic 51.7% |
| Immigrants | Eastern Europe | 0.1 /100 | #280 | Tragic 51.7% |
| Immigrants | Kazakhstan | 0.1 /100 | #281 | Tragic 51.6% |
| Bahamians | 0.1 /100 | #282 | Tragic 51.5% |
| Immigrants | China | 0.1 /100 | #283 | Tragic 51.5% |
| Immigrants | Zaire | 0.1 /100 | #284 | Tragic 51.5% |
| Immigrants | Uruguay | 0.1 /100 | #285 | Tragic 51.4% |
| Immigrants | Liberia | 0.1 /100 | #286 | Tragic 51.3% |
| Immigrants | Serbia | 0.1 /100 | #287 | Tragic 51.3% |
| Okinawans | 0.1 /100 | #288 | Tragic 51.2% |
| Somalis | 0.0 /100 | #289 | Tragic 51.1% |
| Immigrants | Panama | 0.0 /100 | #290 | Tragic 51.1% |
Demographics Similar to Immigrants from Caribbean by 2 or more Vehicles in Household
In terms of 2 or more vehicles in household, the demographic groups most similar to Immigrants from Caribbean are Senegalese (44.2%, a difference of 0.020%), Immigrants from Jamaica (44.5%, a difference of 0.57%), Immigrants from Cabo Verde (43.3%, a difference of 2.1%), Immigrants from West Indies (43.1%, a difference of 2.6%), and Immigrants from Senegal (43.0%, a difference of 2.8%).
| Demographics | Rating | Rank | 2 or more Vehicles in Household |
| Cape Verdeans | 0.0 /100 | #316 | Tragic 46.8% |
| Immigrants | Haiti | 0.0 /100 | #317 | Tragic 46.5% |
| Immigrants | Albania | 0.0 /100 | #318 | Tragic 46.0% |
| Jamaicans | 0.0 /100 | #319 | Tragic 45.8% |
| Soviet Union | 0.0 /100 | #320 | Tragic 45.7% |
| Immigrants | Jamaica | 0.0 /100 | #321 | Tragic 44.5% |
| Senegalese | 0.0 /100 | #322 | Tragic 44.2% |
| Immigrants | Caribbean | 0.0 /100 | #323 | Tragic 44.2% |
| Immigrants | Cabo Verde | 0.0 /100 | #324 | Tragic 43.3% |
| Immigrants | West Indies | 0.0 /100 | #325 | Tragic 43.1% |
| Immigrants | Senegal | 0.0 /100 | #326 | Tragic 43.0% |
| Immigrants | Yemen | 0.0 /100 | #327 | Tragic 42.8% |
| Inupiat | 0.0 /100 | #328 | Tragic 42.6% |
| Ecuadorians | 0.0 /100 | #329 | Tragic 42.0% |
| Immigrants | Dominica | 0.0 /100 | #330 | Tragic 41.6% |