Immigrants from China vs Pakistani 2 or more Vehicles in Household
COMPARE
Immigrants from China
Pakistani
2 or more Vehicles in Household
2 or more Vehicles in Household Comparison
Immigrants from China
Pakistanis
51.5%
2 OR MORE VEHICLES IN HOUSEHOLD
0.1/ 100
METRIC RATING
283rd/ 347
METRIC RANK
57.9%
2 OR MORE VEHICLES IN HOUSEHOLD
99.0/ 100
METRIC RATING
91st/ 347
METRIC RANK
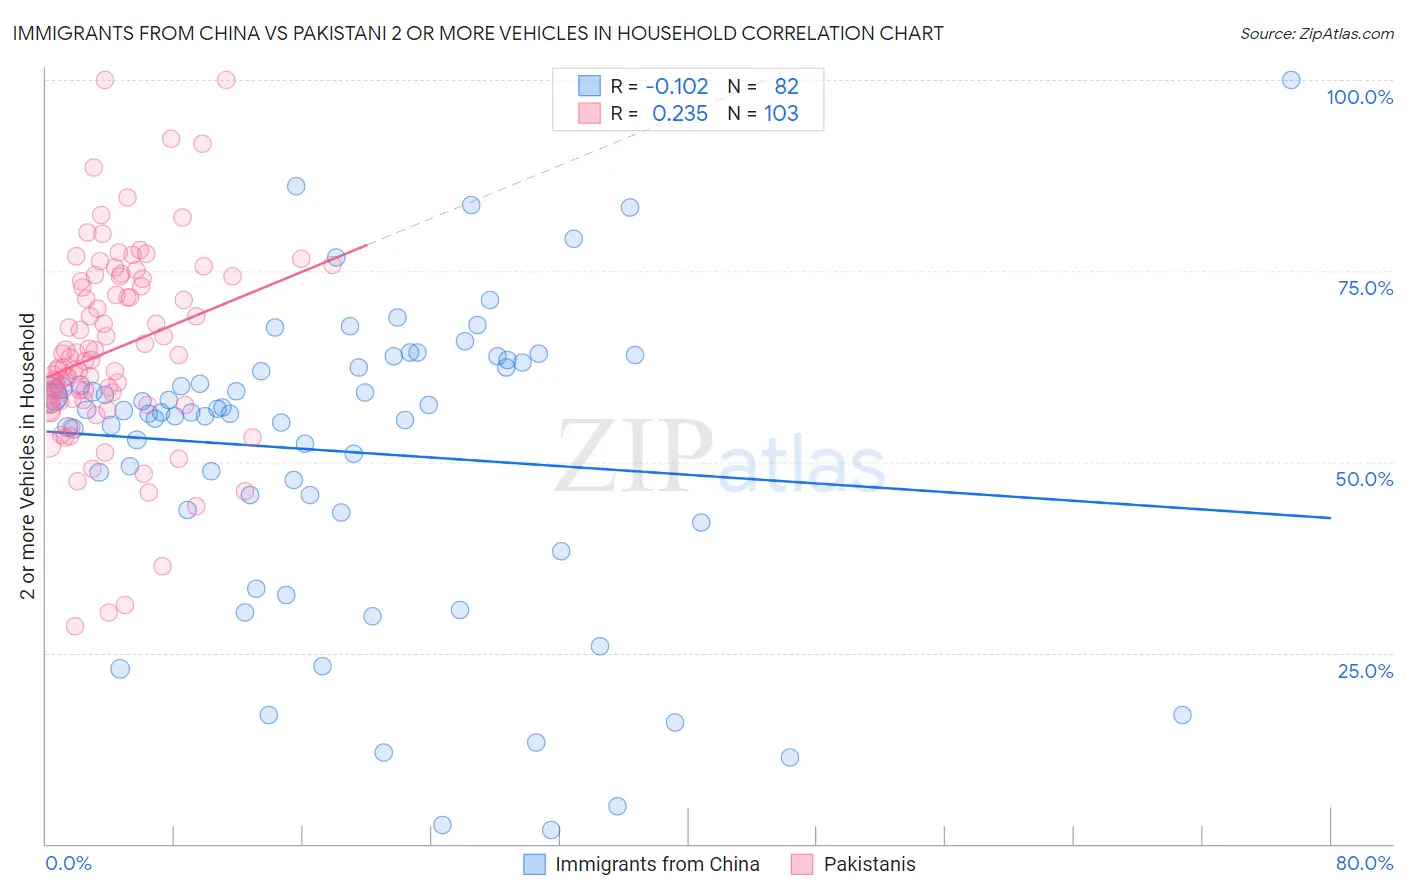
Immigrants from China vs Pakistani 2 or more Vehicles in Household Correlation Chart
The statistical analysis conducted on geographies consisting of 456,653,967 people shows a poor negative correlation between the proportion of Immigrants from China and percentage of households with 2 or more vehicles available in the United States with a correlation coefficient (R) of -0.102 and weighted average of 51.5%. Similarly, the statistical analysis conducted on geographies consisting of 335,209,780 people shows a weak positive correlation between the proportion of Pakistanis and percentage of households with 2 or more vehicles available in the United States with a correlation coefficient (R) of 0.235 and weighted average of 57.9%, a difference of 12.4%.
2 or more Vehicles in Household Correlation Summary
| Measurement | Immigrants from China | Pakistani |
| Minimum | 1.8% | 28.5% |
| Maximum | 100.0% | 100.0% |
| Range | 98.2% | 71.5% |
| Mean | 51.4% | 64.7% |
| Median | 56.4% | 63.3% |
| Interquartile 25% (IQ1) | 43.8% | 57.9% |
| Interquartile 75% (IQ3) | 62.3% | 74.1% |
| Interquartile Range (IQR) | 18.6% | 16.1% |
| Standard Deviation (Sample) | 19.7% | 12.9% |
| Standard Deviation (Population) | 19.6% | 12.9% |
Similar Demographics by 2 or more Vehicles in Household
Demographics Similar to Immigrants from China by 2 or more Vehicles in Household
In terms of 2 or more vehicles in household, the demographic groups most similar to Immigrants from China are Immigrants from Zaire (51.5%, a difference of 0.040%), Bahamian (51.5%, a difference of 0.080%), Immigrants from Kazakhstan (51.6%, a difference of 0.14%), Immigrants from Uruguay (51.4%, a difference of 0.20%), and Immigrants from Liberia (51.3%, a difference of 0.34%).
| Demographics | Rating | Rank | 2 or more Vehicles in Household |
| Immigrants | Croatia | 0.2 /100 | #276 | Tragic 51.8% |
| Immigrants | Africa | 0.2 /100 | #277 | Tragic 51.8% |
| Yuman | 0.1 /100 | #278 | Tragic 51.7% |
| Liberians | 0.1 /100 | #279 | Tragic 51.7% |
| Immigrants | Eastern Europe | 0.1 /100 | #280 | Tragic 51.7% |
| Immigrants | Kazakhstan | 0.1 /100 | #281 | Tragic 51.6% |
| Bahamians | 0.1 /100 | #282 | Tragic 51.5% |
| Immigrants | China | 0.1 /100 | #283 | Tragic 51.5% |
| Immigrants | Zaire | 0.1 /100 | #284 | Tragic 51.5% |
| Immigrants | Uruguay | 0.1 /100 | #285 | Tragic 51.4% |
| Immigrants | Liberia | 0.1 /100 | #286 | Tragic 51.3% |
| Immigrants | Serbia | 0.1 /100 | #287 | Tragic 51.3% |
| Okinawans | 0.1 /100 | #288 | Tragic 51.2% |
| Somalis | 0.0 /100 | #289 | Tragic 51.1% |
| Immigrants | Panama | 0.0 /100 | #290 | Tragic 51.1% |
Demographics Similar to Pakistanis by 2 or more Vehicles in Household
In terms of 2 or more vehicles in household, the demographic groups most similar to Pakistanis are Shoshone (57.9%, a difference of 0.020%), Immigrants from Germany (57.9%, a difference of 0.030%), Hispanic or Latino (57.9%, a difference of 0.030%), Ottawa (57.9%, a difference of 0.030%), and Immigrants from Iran (57.9%, a difference of 0.090%).
| Demographics | Rating | Rank | 2 or more Vehicles in Household |
| Maltese | 99.2 /100 | #84 | Exceptional 58.0% |
| Slovaks | 99.2 /100 | #85 | Exceptional 58.0% |
| Potawatomi | 99.1 /100 | #86 | Exceptional 58.0% |
| Thais | 99.1 /100 | #87 | Exceptional 57.9% |
| Immigrants | Iran | 99.1 /100 | #88 | Exceptional 57.9% |
| Immigrants | Germany | 99.0 /100 | #89 | Exceptional 57.9% |
| Hispanics or Latinos | 99.0 /100 | #90 | Exceptional 57.9% |
| Pakistanis | 99.0 /100 | #91 | Exceptional 57.9% |
| Shoshone | 99.0 /100 | #92 | Exceptional 57.9% |
| Ottawa | 99.0 /100 | #93 | Exceptional 57.9% |
| Filipinos | 98.9 /100 | #94 | Exceptional 57.8% |
| Hmong | 98.9 /100 | #95 | Exceptional 57.8% |
| Burmese | 98.8 /100 | #96 | Exceptional 57.8% |
| Slavs | 98.8 /100 | #97 | Exceptional 57.8% |
| Palestinians | 98.6 /100 | #98 | Exceptional 57.7% |