White/Caucasian vs Immigrants from Middle Africa 2 or more Vehicles in Household
COMPARE
White/Caucasian
Immigrants from Middle Africa
2 or more Vehicles in Household
2 or more Vehicles in Household Comparison
Whites/Caucasians
Immigrants from Middle Africa
60.8%
2 OR MORE VEHICLES IN HOUSEHOLD
100.0/ 100
METRIC RATING
25th/ 347
METRIC RANK
53.4%
2 OR MORE VEHICLES IN HOUSEHOLD
3.0/ 100
METRIC RATING
235th/ 347
METRIC RANK
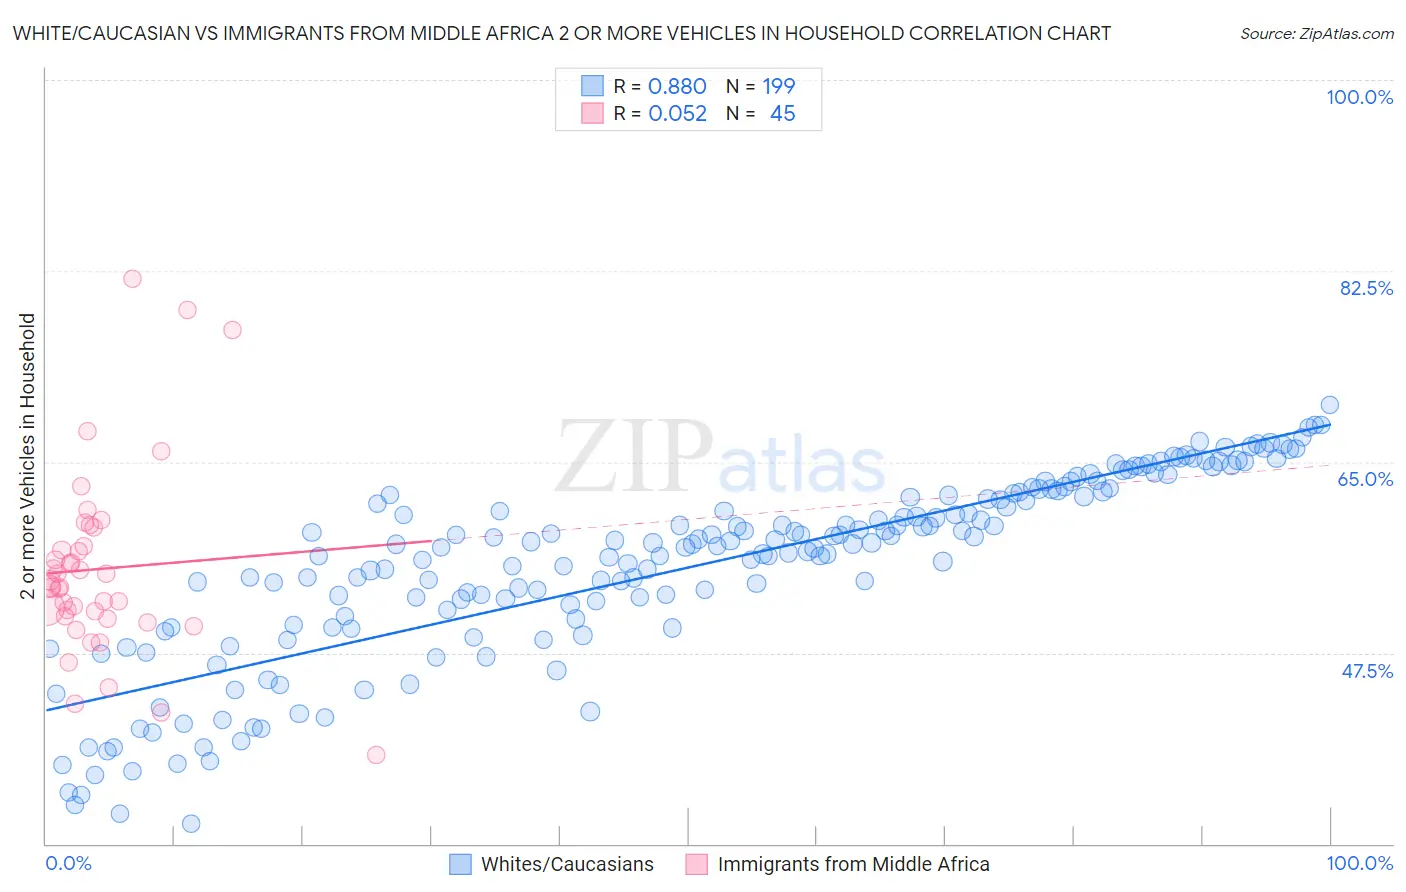
White/Caucasian vs Immigrants from Middle Africa 2 or more Vehicles in Household Correlation Chart
The statistical analysis conducted on geographies consisting of 571,878,025 people shows a very strong positive correlation between the proportion of Whites/Caucasians and percentage of households with 2 or more vehicles available in the United States with a correlation coefficient (R) of 0.880 and weighted average of 60.8%. Similarly, the statistical analysis conducted on geographies consisting of 202,671,217 people shows a slight positive correlation between the proportion of Immigrants from Middle Africa and percentage of households with 2 or more vehicles available in the United States with a correlation coefficient (R) of 0.052 and weighted average of 53.4%, a difference of 13.9%.
2 or more Vehicles in Household Correlation Summary
| Measurement | White/Caucasian | Immigrants from Middle Africa |
| Minimum | 31.8% | 38.1% |
| Maximum | 70.2% | 81.8% |
| Range | 38.4% | 43.7% |
| Mean | 55.3% | 55.2% |
| Median | 57.5% | 53.5% |
| Interquartile 25% (IQ1) | 50.1% | 50.8% |
| Interquartile 75% (IQ3) | 61.9% | 58.1% |
| Interquartile Range (IQR) | 11.8% | 7.4% |
| Standard Deviation (Sample) | 8.6% | 8.7% |
| Standard Deviation (Population) | 8.6% | 8.6% |
Similar Demographics by 2 or more Vehicles in Household
Demographics Similar to Whites/Caucasians by 2 or more Vehicles in Household
In terms of 2 or more vehicles in household, the demographic groups most similar to Whites/Caucasians are Welsh (60.8%, a difference of 0.050%), Immigrants from Vietnam (60.9%, a difference of 0.15%), Scotch-Irish (60.9%, a difference of 0.19%), Swiss (61.0%, a difference of 0.23%), and Korean (61.0%, a difference of 0.26%).
| Demographics | Rating | Rank | 2 or more Vehicles in Household |
| Europeans | 100.0 /100 | #18 | Exceptional 61.4% |
| Scottish | 100.0 /100 | #19 | Exceptional 61.2% |
| Sri Lankans | 100.0 /100 | #20 | Exceptional 61.0% |
| Koreans | 100.0 /100 | #21 | Exceptional 61.0% |
| Swiss | 100.0 /100 | #22 | Exceptional 61.0% |
| Scotch-Irish | 100.0 /100 | #23 | Exceptional 60.9% |
| Immigrants | Vietnam | 100.0 /100 | #24 | Exceptional 60.9% |
| Whites/Caucasians | 100.0 /100 | #25 | Exceptional 60.8% |
| Welsh | 100.0 /100 | #26 | Exceptional 60.8% |
| Assyrians/Chaldeans/Syriacs | 100.0 /100 | #27 | Exceptional 60.5% |
| Guamanians/Chamorros | 100.0 /100 | #28 | Exceptional 60.5% |
| Hawaiians | 100.0 /100 | #29 | Exceptional 60.4% |
| Finns | 100.0 /100 | #30 | Exceptional 60.3% |
| Spanish American Indians | 100.0 /100 | #31 | Exceptional 60.3% |
| Arapaho | 100.0 /100 | #32 | Exceptional 60.2% |
Demographics Similar to Immigrants from Middle Africa by 2 or more Vehicles in Household
In terms of 2 or more vehicles in household, the demographic groups most similar to Immigrants from Middle Africa are Immigrants from Switzerland (53.4%, a difference of 0.030%), Immigrants from Guatemala (53.5%, a difference of 0.090%), Ugandan (53.5%, a difference of 0.090%), Indonesian (53.4%, a difference of 0.10%), and Panamanian (53.5%, a difference of 0.16%).
| Demographics | Rating | Rank | 2 or more Vehicles in Household |
| Alaska Natives | 3.9 /100 | #228 | Tragic 53.6% |
| Immigrants | Turkey | 3.8 /100 | #229 | Tragic 53.6% |
| Immigrants | Nepal | 3.6 /100 | #230 | Tragic 53.5% |
| Panamanians | 3.4 /100 | #231 | Tragic 53.5% |
| Immigrants | Guatemala | 3.2 /100 | #232 | Tragic 53.5% |
| Ugandans | 3.2 /100 | #233 | Tragic 53.5% |
| Immigrants | Switzerland | 3.0 /100 | #234 | Tragic 53.4% |
| Immigrants | Middle Africa | 3.0 /100 | #235 | Tragic 53.4% |
| Indonesians | 2.7 /100 | #236 | Tragic 53.4% |
| Macedonians | 2.4 /100 | #237 | Tragic 53.3% |
| Immigrants | Armenia | 2.3 /100 | #238 | Tragic 53.3% |
| Cambodians | 2.3 /100 | #239 | Tragic 53.3% |
| Immigrants | Europe | 2.1 /100 | #240 | Tragic 53.2% |
| Immigrants | Sierra Leone | 2.1 /100 | #241 | Tragic 53.2% |
| Immigrants | Eastern Asia | 2.1 /100 | #242 | Tragic 53.2% |