Immigrants from Cameroon vs Immigrants from North Macedonia Unemployment Among Ages 65 to 74 years
COMPARE
Immigrants from Cameroon
Immigrants from North Macedonia
Unemployment Among Ages 65 to 74 years
Unemployment Among Ages 65 to 74 years Comparison
Immigrants from Cameroon
Immigrants from North Macedonia
5.3%
UNEMPLOYMENT AMONG AGES 65 TO 74 YEARS
72.1/ 100
METRIC RATING
155th/ 347
METRIC RANK
4.8%
UNEMPLOYMENT AMONG AGES 65 TO 74 YEARS
100.0/ 100
METRIC RATING
15th/ 347
METRIC RANK
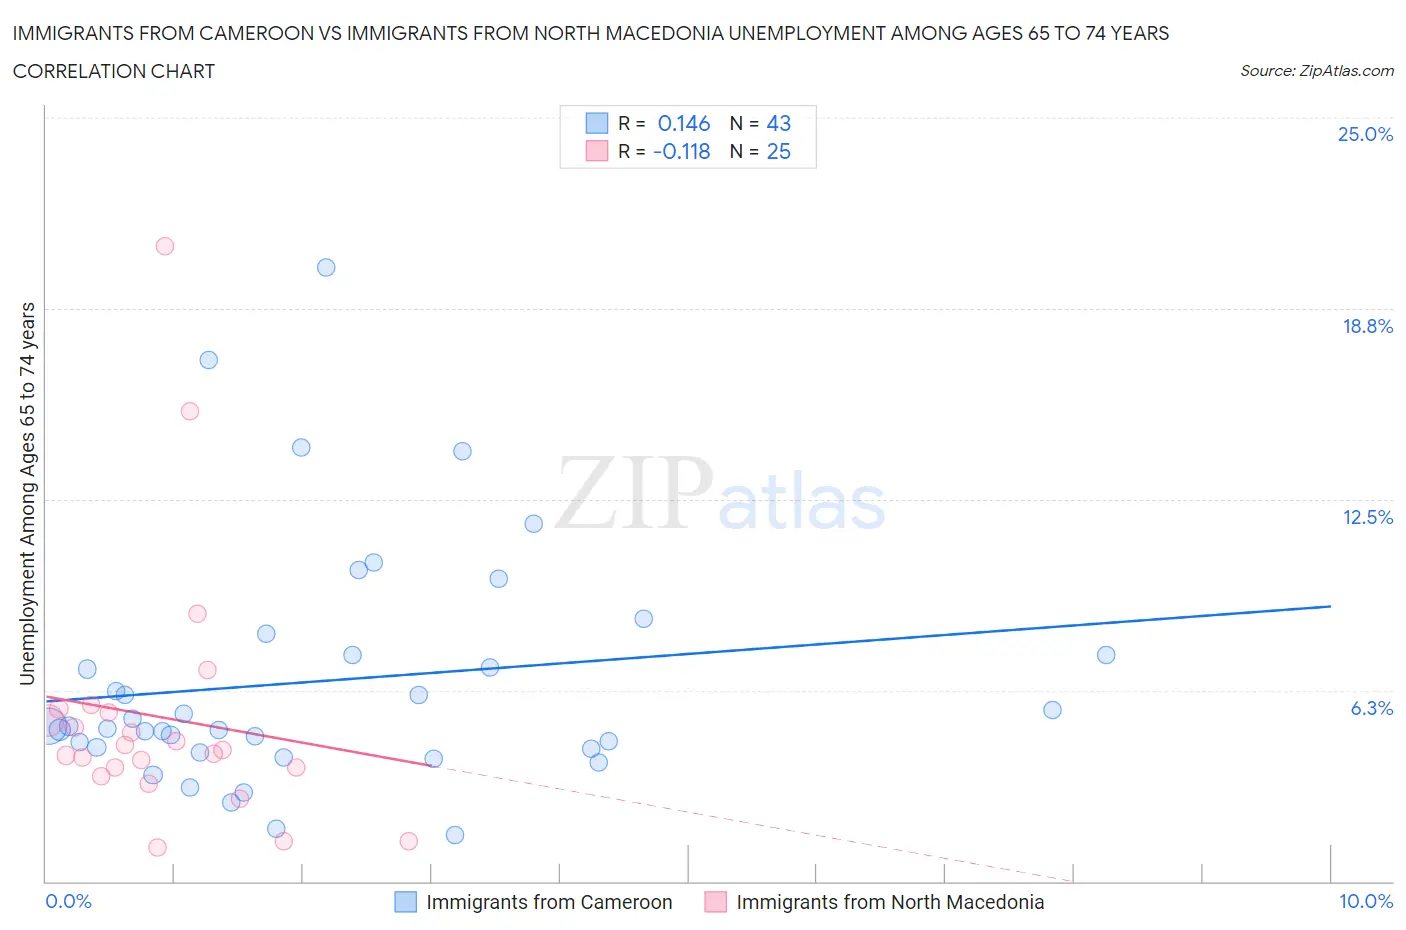
Immigrants from Cameroon vs Immigrants from North Macedonia Unemployment Among Ages 65 to 74 years Correlation Chart
The statistical analysis conducted on geographies consisting of 124,064,876 people shows a poor positive correlation between the proportion of Immigrants from Cameroon and unemployment rate among population between the ages 65 and 74 in the United States with a correlation coefficient (R) of 0.146 and weighted average of 5.3%. Similarly, the statistical analysis conducted on geographies consisting of 71,124,055 people shows a poor negative correlation between the proportion of Immigrants from North Macedonia and unemployment rate among population between the ages 65 and 74 in the United States with a correlation coefficient (R) of -0.118 and weighted average of 4.8%, a difference of 10.8%.
Unemployment Among Ages 65 to 74 years Correlation Summary
| Measurement | Immigrants from Cameroon | Immigrants from North Macedonia |
| Minimum | 1.5% | 1.1% |
| Maximum | 20.1% | 20.8% |
| Range | 18.6% | 19.7% |
| Mean | 6.5% | 5.4% |
| Median | 5.1% | 4.3% |
| Interquartile 25% (IQ1) | 4.3% | 3.6% |
| Interquartile 75% (IQ3) | 7.4% | 5.6% |
| Interquartile Range (IQR) | 3.1% | 2.0% |
| Standard Deviation (Sample) | 3.9% | 4.3% |
| Standard Deviation (Population) | 3.9% | 4.2% |
Similar Demographics by Unemployment Among Ages 65 to 74 years
Demographics Similar to Immigrants from Cameroon by Unemployment Among Ages 65 to 74 years
In terms of unemployment among ages 65 to 74 years, the demographic groups most similar to Immigrants from Cameroon are Dutch (5.3%, a difference of 0.0%), Polish (5.3%, a difference of 0.010%), Spanish (5.3%, a difference of 0.020%), Immigrants from Cabo Verde (5.3%, a difference of 0.020%), and Immigrants from Eastern Europe (5.3%, a difference of 0.020%).
| Demographics | Rating | Rank | Unemployment Among Ages 65 to 74 years |
| Immigrants | Sri Lanka | 73.8 /100 | #148 | Good 5.3% |
| Immigrants | Romania | 73.5 /100 | #149 | Good 5.3% |
| Immigrants | Poland | 73.2 /100 | #150 | Good 5.3% |
| Immigrants | Indonesia | 72.9 /100 | #151 | Good 5.3% |
| Spanish | 72.6 /100 | #152 | Good 5.3% |
| Immigrants | Cabo Verde | 72.5 /100 | #153 | Good 5.3% |
| Poles | 72.4 /100 | #154 | Good 5.3% |
| Immigrants | Cameroon | 72.1 /100 | #155 | Good 5.3% |
| Dutch | 72.0 /100 | #156 | Good 5.3% |
| Immigrants | Eastern Europe | 71.5 /100 | #157 | Good 5.3% |
| Immigrants | France | 71.0 /100 | #158 | Good 5.3% |
| Immigrants | Czechoslovakia | 66.3 /100 | #159 | Good 5.3% |
| Bangladeshis | 65.8 /100 | #160 | Good 5.3% |
| Immigrants | Italy | 63.7 /100 | #161 | Good 5.3% |
| Immigrants | Eastern Asia | 62.5 /100 | #162 | Good 5.3% |
Demographics Similar to Immigrants from North Macedonia by Unemployment Among Ages 65 to 74 years
In terms of unemployment among ages 65 to 74 years, the demographic groups most similar to Immigrants from North Macedonia are Immigrants from Burma/Myanmar (4.8%, a difference of 0.29%), Kenyan (4.8%, a difference of 0.31%), Creek (4.8%, a difference of 0.39%), Menominee (4.8%, a difference of 0.43%), and Immigrants from Zaire (4.8%, a difference of 0.69%).
| Demographics | Rating | Rank | Unemployment Among Ages 65 to 74 years |
| Comanche | 100.0 /100 | #8 | Exceptional 4.7% |
| Chickasaw | 100.0 /100 | #9 | Exceptional 4.7% |
| Osage | 100.0 /100 | #10 | Exceptional 4.7% |
| Immigrants | Congo | 100.0 /100 | #11 | Exceptional 4.7% |
| Tongans | 100.0 /100 | #12 | Exceptional 4.7% |
| Lumbee | 100.0 /100 | #13 | Exceptional 4.8% |
| Cubans | 100.0 /100 | #14 | Exceptional 4.8% |
| Immigrants | North Macedonia | 100.0 /100 | #15 | Exceptional 4.8% |
| Immigrants | Burma/Myanmar | 100.0 /100 | #16 | Exceptional 4.8% |
| Kenyans | 100.0 /100 | #17 | Exceptional 4.8% |
| Creek | 100.0 /100 | #18 | Exceptional 4.8% |
| Menominee | 100.0 /100 | #19 | Exceptional 4.8% |
| Immigrants | Zaire | 100.0 /100 | #20 | Exceptional 4.8% |
| Immigrants | Eritrea | 100.0 /100 | #21 | Exceptional 4.9% |
| Lebanese | 100.0 /100 | #22 | Exceptional 4.9% |