Immigrants from Belgium vs Immigrants from Grenada Per Capita Income
COMPARE
Immigrants from Belgium
Immigrants from Grenada
Per Capita Income
Per Capita Income Comparison
Immigrants from Belgium
Immigrants from Grenada
$55,082
PER CAPITA INCOME
100.0/ 100
METRIC RATING
14th/ 347
METRIC RANK
$41,123
PER CAPITA INCOME
5.5/ 100
METRIC RATING
228th/ 347
METRIC RANK
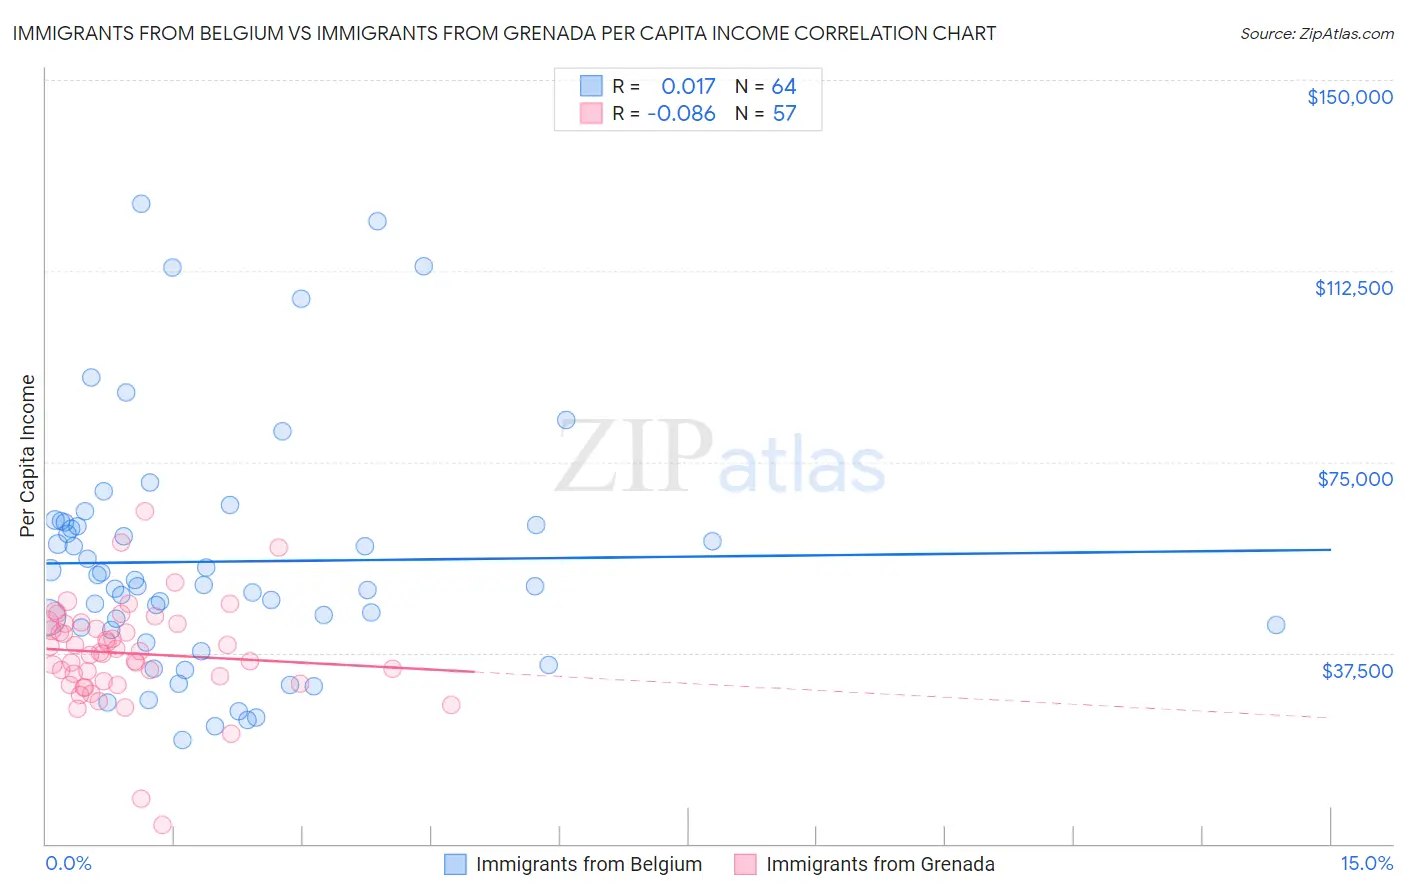
Immigrants from Belgium vs Immigrants from Grenada Per Capita Income Correlation Chart
The statistical analysis conducted on geographies consisting of 146,715,223 people shows no correlation between the proportion of Immigrants from Belgium and per capita income in the United States with a correlation coefficient (R) of 0.017 and weighted average of $55,082. Similarly, the statistical analysis conducted on geographies consisting of 67,200,351 people shows a slight negative correlation between the proportion of Immigrants from Grenada and per capita income in the United States with a correlation coefficient (R) of -0.086 and weighted average of $41,123, a difference of 34.0%.
Per Capita Income Correlation Summary
| Measurement | Immigrants from Belgium | Immigrants from Grenada |
| Minimum | $20,313 | $3,645 |
| Maximum | $125,796 | $65,209 |
| Range | $105,483 | $61,564 |
| Mean | $55,426 | $37,400 |
| Median | $50,708 | $37,479 |
| Interquartile 25% (IQ1) | $42,261 | $31,664 |
| Interquartile 75% (IQ3) | $62,896 | $43,240 |
| Interquartile Range (IQR) | $20,635 | $11,576 |
| Standard Deviation (Sample) | $23,673 | $10,138 |
| Standard Deviation (Population) | $23,487 | $10,049 |
Similar Demographics by Per Capita Income
Demographics Similar to Immigrants from Belgium by Per Capita Income
In terms of per capita income, the demographic groups most similar to Immigrants from Belgium are Cypriot ($54,899, a difference of 0.33%), Immigrants from India ($55,268, a difference of 0.34%), Immigrants from Switzerland ($54,866, a difference of 0.39%), Immigrants from Sweden ($55,582, a difference of 0.91%), and Immigrants from France ($54,557, a difference of 0.96%).
| Demographics | Rating | Rank | Per Capita Income |
| Immigrants | Israel | 100.0 /100 | #7 | Exceptional $57,384 |
| Immigrants | Hong Kong | 100.0 /100 | #8 | Exceptional $56,709 |
| Immigrants | Ireland | 100.0 /100 | #9 | Exceptional $56,584 |
| Okinawans | 100.0 /100 | #10 | Exceptional $55,817 |
| Eastern Europeans | 100.0 /100 | #11 | Exceptional $55,780 |
| Immigrants | Sweden | 100.0 /100 | #12 | Exceptional $55,582 |
| Immigrants | India | 100.0 /100 | #13 | Exceptional $55,268 |
| Immigrants | Belgium | 100.0 /100 | #14 | Exceptional $55,082 |
| Cypriots | 100.0 /100 | #15 | Exceptional $54,899 |
| Immigrants | Switzerland | 100.0 /100 | #16 | Exceptional $54,866 |
| Immigrants | France | 100.0 /100 | #17 | Exceptional $54,557 |
| Thais | 100.0 /100 | #18 | Exceptional $54,307 |
| Immigrants | China | 100.0 /100 | #19 | Exceptional $54,264 |
| Soviet Union | 100.0 /100 | #20 | Exceptional $54,202 |
| Immigrants | Northern Europe | 100.0 /100 | #21 | Exceptional $54,159 |
Demographics Similar to Immigrants from Grenada by Per Capita Income
In terms of per capita income, the demographic groups most similar to Immigrants from Grenada are Immigrants from Ghana ($41,131, a difference of 0.020%), Immigrants from Ecuador ($41,195, a difference of 0.17%), West Indian ($41,217, a difference of 0.23%), Nigerian ($41,026, a difference of 0.24%), and Native Hawaiian ($41,017, a difference of 0.26%).
| Demographics | Rating | Rank | Per Capita Income |
| Immigrants | Trinidad and Tobago | 7.9 /100 | #221 | Tragic $41,476 |
| Immigrants | Iraq | 7.1 /100 | #222 | Tragic $41,365 |
| Immigrants | Cameroon | 6.8 /100 | #223 | Tragic $41,334 |
| Immigrants | St. Vincent and the Grenadines | 6.4 /100 | #224 | Tragic $41,270 |
| West Indians | 6.0 /100 | #225 | Tragic $41,217 |
| Immigrants | Ecuador | 5.9 /100 | #226 | Tragic $41,195 |
| Immigrants | Ghana | 5.5 /100 | #227 | Tragic $41,131 |
| Immigrants | Grenada | 5.5 /100 | #228 | Tragic $41,123 |
| Nigerians | 4.9 /100 | #229 | Tragic $41,026 |
| Native Hawaiians | 4.9 /100 | #230 | Tragic $41,017 |
| Senegalese | 4.8 /100 | #231 | Tragic $41,000 |
| Guyanese | 4.5 /100 | #232 | Tragic $40,949 |
| Delaware | 3.8 /100 | #233 | Tragic $40,778 |
| Immigrants | West Indies | 3.7 /100 | #234 | Tragic $40,763 |
| Immigrants | Guyana | 3.6 /100 | #235 | Tragic $40,742 |