Native/Alaskan vs Immigrants from Grenada 2 or more Vehicles in Household
COMPARE
Native/Alaskan
Immigrants from Grenada
2 or more Vehicles in Household
2 or more Vehicles in Household Comparison
Natives/Alaskans
Immigrants from Grenada
57.0%
2 OR MORE VEHICLES IN HOUSEHOLD
95.0/ 100
METRIC RATING
119th/ 347
METRIC RANK
28.7%
2 OR MORE VEHICLES IN HOUSEHOLD
0.0/ 100
METRIC RATING
347th/ 347
METRIC RANK
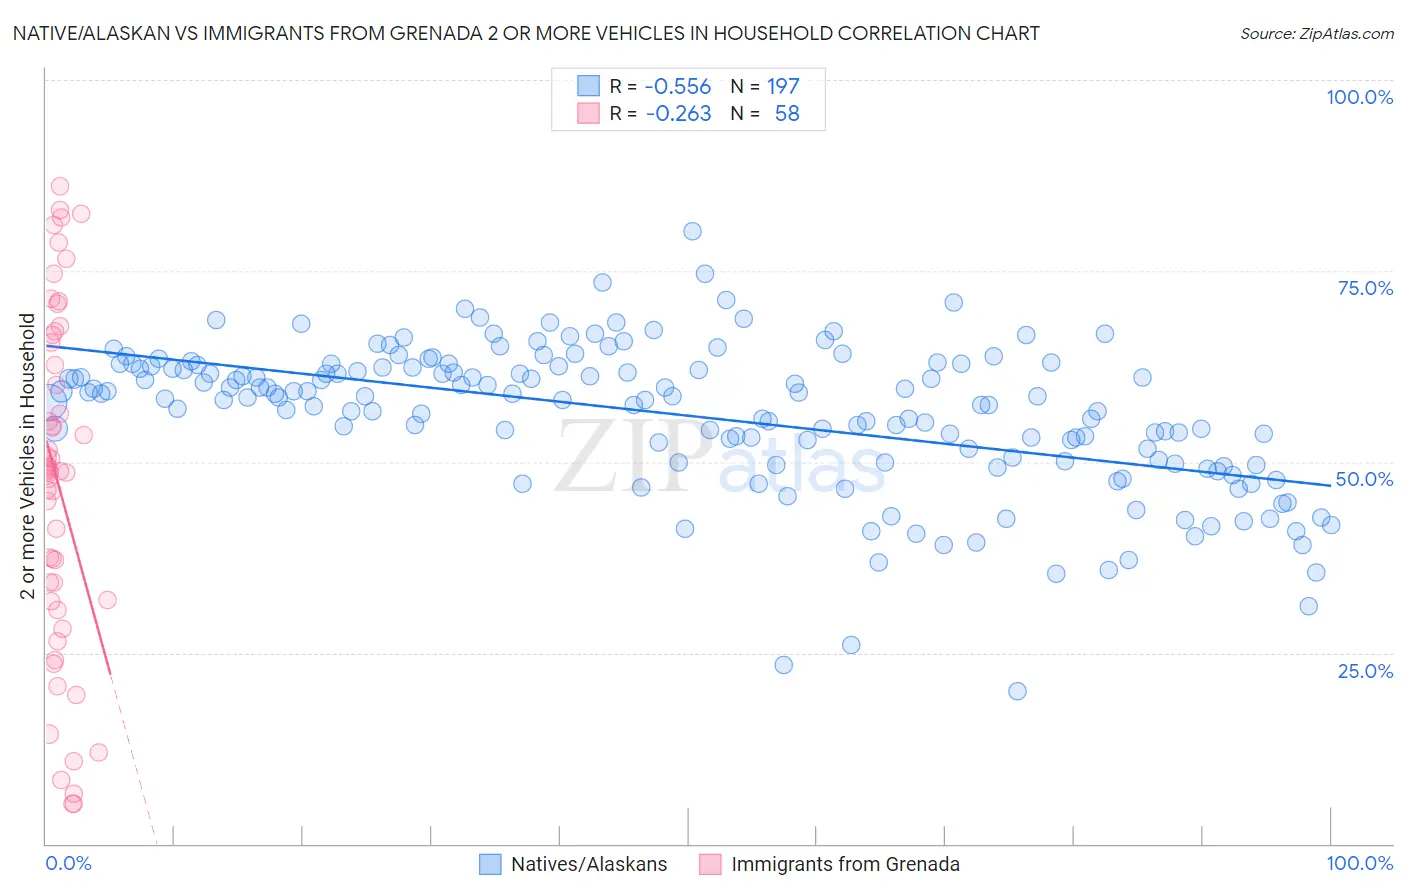
Native/Alaskan vs Immigrants from Grenada 2 or more Vehicles in Household Correlation Chart
The statistical analysis conducted on geographies consisting of 512,668,217 people shows a substantial negative correlation between the proportion of Natives/Alaskans and percentage of households with 2 or more vehicles available in the United States with a correlation coefficient (R) of -0.556 and weighted average of 57.0%. Similarly, the statistical analysis conducted on geographies consisting of 67,200,374 people shows a weak negative correlation between the proportion of Immigrants from Grenada and percentage of households with 2 or more vehicles available in the United States with a correlation coefficient (R) of -0.263 and weighted average of 28.7%, a difference of 98.7%.
2 or more Vehicles in Household Correlation Summary
| Measurement | Native/Alaskan | Immigrants from Grenada |
| Minimum | 20.0% | 5.2% |
| Maximum | 80.2% | 86.2% |
| Range | 60.2% | 81.0% |
| Mean | 56.1% | 46.9% |
| Median | 58.5% | 48.8% |
| Interquartile 25% (IQ1) | 50.1% | 31.8% |
| Interquartile 75% (IQ3) | 62.5% | 65.6% |
| Interquartile Range (IQR) | 12.4% | 33.8% |
| Standard Deviation (Sample) | 9.6% | 22.2% |
| Standard Deviation (Population) | 9.6% | 22.0% |
Similar Demographics by 2 or more Vehicles in Household
Demographics Similar to Natives/Alaskans by 2 or more Vehicles in Household
In terms of 2 or more vehicles in household, the demographic groups most similar to Natives/Alaskans are Asian (57.0%, a difference of 0.030%), Costa Rican (56.9%, a difference of 0.050%), Iraqi (57.1%, a difference of 0.19%), Sioux (56.8%, a difference of 0.21%), and Immigrants from Jordan (57.2%, a difference of 0.38%).
| Demographics | Rating | Rank | 2 or more Vehicles in Household |
| Pueblo | 98.0 /100 | #112 | Exceptional 57.5% |
| Zimbabweans | 96.9 /100 | #113 | Exceptional 57.2% |
| Immigrants | Lebanon | 96.8 /100 | #114 | Exceptional 57.2% |
| Chippewa | 96.6 /100 | #115 | Exceptional 57.2% |
| Immigrants | Jordan | 96.6 /100 | #116 | Exceptional 57.2% |
| Iraqis | 95.8 /100 | #117 | Exceptional 57.1% |
| Asians | 95.1 /100 | #118 | Exceptional 57.0% |
| Natives/Alaskans | 95.0 /100 | #119 | Exceptional 57.0% |
| Costa Ricans | 94.7 /100 | #120 | Exceptional 56.9% |
| Sioux | 93.8 /100 | #121 | Exceptional 56.8% |
| Immigrants | South Africa | 92.5 /100 | #122 | Exceptional 56.7% |
| Australians | 91.8 /100 | #123 | Exceptional 56.7% |
| New Zealanders | 91.8 /100 | #124 | Exceptional 56.7% |
| Tsimshian | 91.6 /100 | #125 | Exceptional 56.7% |
| Estonians | 90.9 /100 | #126 | Exceptional 56.6% |
Demographics Similar to Immigrants from Grenada by 2 or more Vehicles in Household
In terms of 2 or more vehicles in household, the demographic groups most similar to Immigrants from Grenada are Immigrants from St. Vincent and the Grenadines (31.0%, a difference of 8.1%), Immigrants from Dominican Republic (33.2%, a difference of 16.0%), Yup'ik (34.9%, a difference of 21.9%), Immigrants from Guyana (35.0%, a difference of 22.1%), and Dominican (35.3%, a difference of 23.2%).
| Demographics | Rating | Rank | 2 or more Vehicles in Household |
| Immigrants | Ecuador | 0.0 /100 | #333 | Tragic 40.5% |
| Immigrants | Trinidad and Tobago | 0.0 /100 | #334 | Tragic 40.3% |
| Immigrants | Bangladesh | 0.0 /100 | #335 | Tragic 38.8% |
| Vietnamese | 0.0 /100 | #336 | Tragic 38.5% |
| Barbadians | 0.0 /100 | #337 | Tragic 38.3% |
| Immigrants | Uzbekistan | 0.0 /100 | #338 | Tragic 37.9% |
| Immigrants | Barbados | 0.0 /100 | #339 | Tragic 35.8% |
| British West Indians | 0.0 /100 | #340 | Tragic 35.4% |
| Guyanese | 0.0 /100 | #341 | Tragic 35.4% |
| Dominicans | 0.0 /100 | #342 | Tragic 35.3% |
| Immigrants | Guyana | 0.0 /100 | #343 | Tragic 35.0% |
| Yup'ik | 0.0 /100 | #344 | Tragic 34.9% |
| Immigrants | Dominican Republic | 0.0 /100 | #345 | Tragic 33.2% |
| Immigrants | St. Vincent and the Grenadines | 0.0 /100 | #346 | Tragic 31.0% |
| Immigrants | Grenada | 0.0 /100 | #347 | Tragic 28.7% |