Immigrants from Pakistan vs Immigrants from Grenada 2 or more Vehicles in Household
COMPARE
Immigrants from Pakistan
Immigrants from Grenada
2 or more Vehicles in Household
2 or more Vehicles in Household Comparison
Immigrants from Pakistan
Immigrants from Grenada
56.1%
2 OR MORE VEHICLES IN HOUSEHOLD
78.1/ 100
METRIC RATING
152nd/ 347
METRIC RANK
28.7%
2 OR MORE VEHICLES IN HOUSEHOLD
0.0/ 100
METRIC RATING
347th/ 347
METRIC RANK
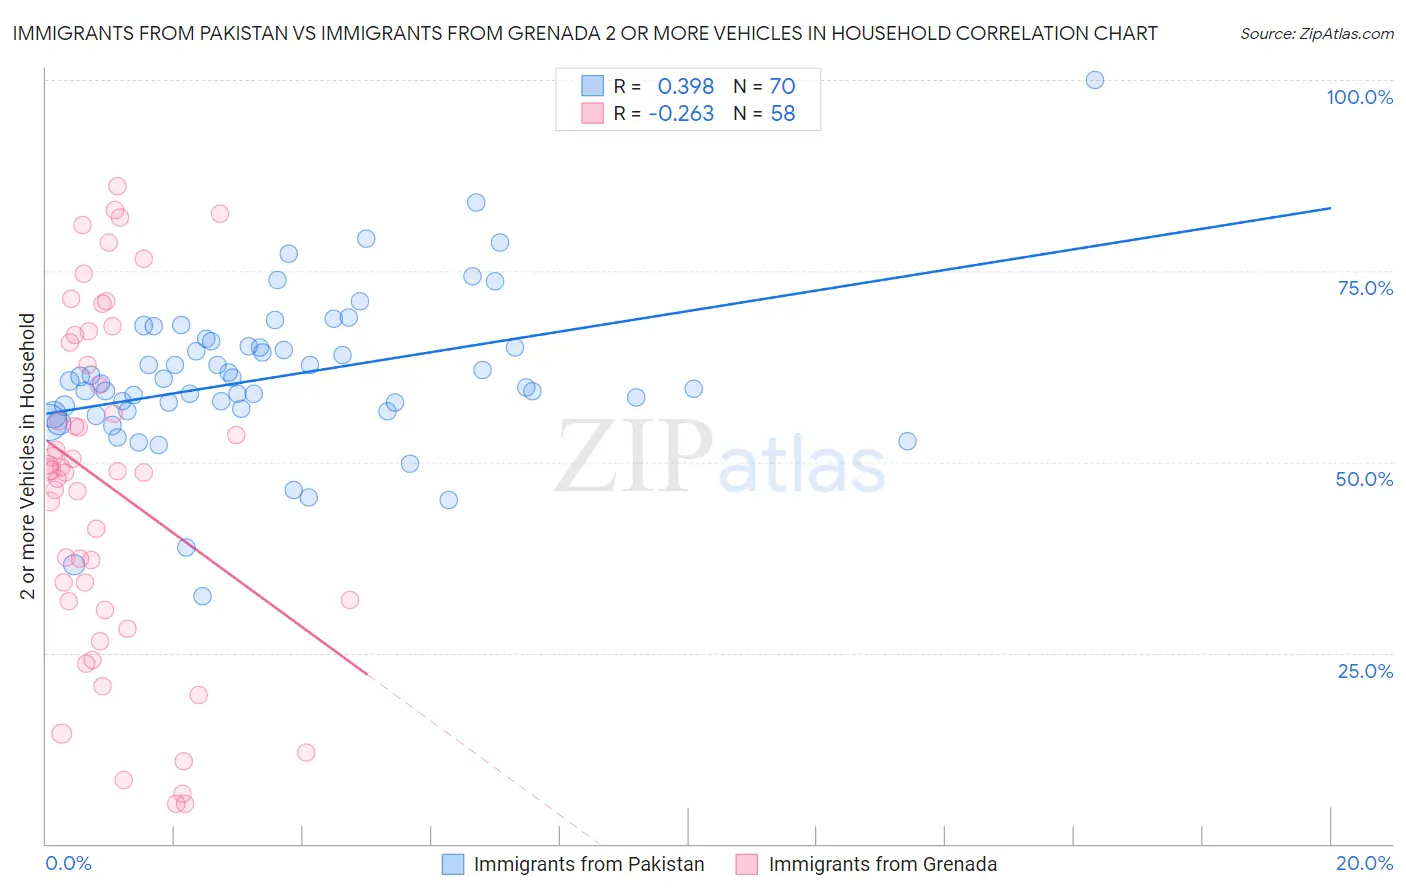
Immigrants from Pakistan vs Immigrants from Grenada 2 or more Vehicles in Household Correlation Chart
The statistical analysis conducted on geographies consisting of 283,700,045 people shows a mild positive correlation between the proportion of Immigrants from Pakistan and percentage of households with 2 or more vehicles available in the United States with a correlation coefficient (R) of 0.398 and weighted average of 56.1%. Similarly, the statistical analysis conducted on geographies consisting of 67,200,374 people shows a weak negative correlation between the proportion of Immigrants from Grenada and percentage of households with 2 or more vehicles available in the United States with a correlation coefficient (R) of -0.263 and weighted average of 28.7%, a difference of 95.6%.
2 or more Vehicles in Household Correlation Summary
| Measurement | Immigrants from Pakistan | Immigrants from Grenada |
| Minimum | 32.5% | 5.2% |
| Maximum | 100.0% | 86.2% |
| Range | 67.5% | 81.0% |
| Mean | 61.1% | 46.9% |
| Median | 60.5% | 48.8% |
| Interquartile 25% (IQ1) | 56.7% | 31.8% |
| Interquartile 75% (IQ3) | 65.2% | 65.6% |
| Interquartile Range (IQR) | 8.5% | 33.8% |
| Standard Deviation (Sample) | 10.3% | 22.2% |
| Standard Deviation (Population) | 10.3% | 22.0% |
Similar Demographics by 2 or more Vehicles in Household
Demographics Similar to Immigrants from Pakistan by 2 or more Vehicles in Household
In terms of 2 or more vehicles in household, the demographic groups most similar to Immigrants from Pakistan are Immigrants from Northern Europe (56.1%, a difference of 0.030%), Nicaraguan (56.1%, a difference of 0.10%), Immigrants from Moldova (56.1%, a difference of 0.12%), Chilean (56.1%, a difference of 0.12%), and Serbian (56.1%, a difference of 0.13%).
| Demographics | Rating | Rank | 2 or more Vehicles in Household |
| Syrians | 81.2 /100 | #145 | Excellent 56.2% |
| Venezuelans | 80.7 /100 | #146 | Excellent 56.1% |
| Serbians | 80.3 /100 | #147 | Excellent 56.1% |
| Immigrants | Moldova | 80.2 /100 | #148 | Excellent 56.1% |
| Chileans | 80.2 /100 | #149 | Excellent 56.1% |
| Nicaraguans | 79.9 /100 | #150 | Good 56.1% |
| Immigrants | Northern Europe | 78.7 /100 | #151 | Good 56.1% |
| Immigrants | Pakistan | 78.1 /100 | #152 | Good 56.1% |
| Lumbee | 71.9 /100 | #153 | Good 55.9% |
| Ukrainians | 70.8 /100 | #154 | Good 55.8% |
| Immigrants | Venezuela | 70.7 /100 | #155 | Good 55.8% |
| Immigrants | Lithuania | 70.4 /100 | #156 | Good 55.8% |
| Immigrants | Kuwait | 70.2 /100 | #157 | Good 55.8% |
| Tlingit-Haida | 68.5 /100 | #158 | Good 55.8% |
| Paiute | 68.0 /100 | #159 | Good 55.8% |
Demographics Similar to Immigrants from Grenada by 2 or more Vehicles in Household
In terms of 2 or more vehicles in household, the demographic groups most similar to Immigrants from Grenada are Immigrants from St. Vincent and the Grenadines (31.0%, a difference of 8.1%), Immigrants from Dominican Republic (33.2%, a difference of 16.0%), Yup'ik (34.9%, a difference of 21.9%), Immigrants from Guyana (35.0%, a difference of 22.1%), and Dominican (35.3%, a difference of 23.2%).
| Demographics | Rating | Rank | 2 or more Vehicles in Household |
| Immigrants | Ecuador | 0.0 /100 | #333 | Tragic 40.5% |
| Immigrants | Trinidad and Tobago | 0.0 /100 | #334 | Tragic 40.3% |
| Immigrants | Bangladesh | 0.0 /100 | #335 | Tragic 38.8% |
| Vietnamese | 0.0 /100 | #336 | Tragic 38.5% |
| Barbadians | 0.0 /100 | #337 | Tragic 38.3% |
| Immigrants | Uzbekistan | 0.0 /100 | #338 | Tragic 37.9% |
| Immigrants | Barbados | 0.0 /100 | #339 | Tragic 35.8% |
| British West Indians | 0.0 /100 | #340 | Tragic 35.4% |
| Guyanese | 0.0 /100 | #341 | Tragic 35.4% |
| Dominicans | 0.0 /100 | #342 | Tragic 35.3% |
| Immigrants | Guyana | 0.0 /100 | #343 | Tragic 35.0% |
| Yup'ik | 0.0 /100 | #344 | Tragic 34.9% |
| Immigrants | Dominican Republic | 0.0 /100 | #345 | Tragic 33.2% |
| Immigrants | St. Vincent and the Grenadines | 0.0 /100 | #346 | Tragic 31.0% |
| Immigrants | Grenada | 0.0 /100 | #347 | Tragic 28.7% |