Immigrants from Belgium vs Immigrants from Grenada Median Male Earnings
COMPARE
Immigrants from Belgium
Immigrants from Grenada
Median Male Earnings
Median Male Earnings Comparison
Immigrants from Belgium
Immigrants from Grenada
$66,125
MEDIAN MALE EARNINGS
100.0/ 100
METRIC RATING
17th/ 347
METRIC RANK
$50,279
MEDIAN MALE EARNINGS
1.6/ 100
METRIC RATING
251st/ 347
METRIC RANK
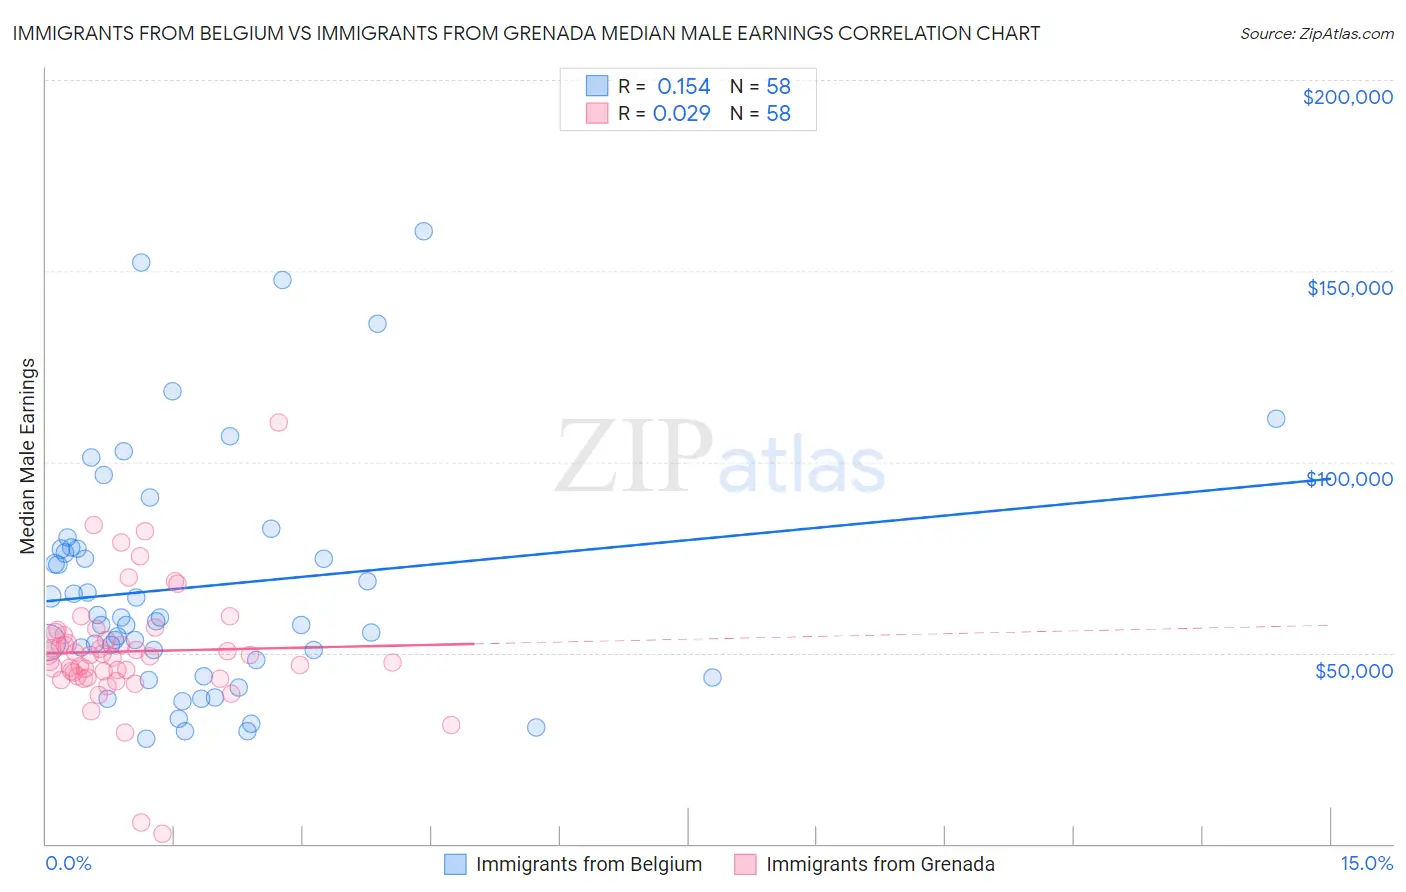
Immigrants from Belgium vs Immigrants from Grenada Median Male Earnings Correlation Chart
The statistical analysis conducted on geographies consisting of 146,683,317 people shows a poor positive correlation between the proportion of Immigrants from Belgium and median male earnings in the United States with a correlation coefficient (R) of 0.154 and weighted average of $66,125. Similarly, the statistical analysis conducted on geographies consisting of 67,198,306 people shows no correlation between the proportion of Immigrants from Grenada and median male earnings in the United States with a correlation coefficient (R) of 0.029 and weighted average of $50,279, a difference of 31.5%.
Median Male Earnings Correlation Summary
| Measurement | Immigrants from Belgium | Immigrants from Grenada |
| Minimum | $27,540 | $2,499 |
| Maximum | $160,536 | $110,313 |
| Range | $132,996 | $107,814 |
| Mean | $67,352 | $50,381 |
| Median | $58,812 | $49,246 |
| Interquartile 25% (IQ1) | $48,036 | $43,797 |
| Interquartile 75% (IQ3) | $77,202 | $54,582 |
| Interquartile Range (IQR) | $29,166 | $10,785 |
| Standard Deviation (Sample) | $31,129 | $16,114 |
| Standard Deviation (Population) | $30,859 | $15,975 |
Similar Demographics by Median Male Earnings
Demographics Similar to Immigrants from Belgium by Median Male Earnings
In terms of median male earnings, the demographic groups most similar to Immigrants from Belgium are Indian (Asian) ($66,078, a difference of 0.070%), Eastern European ($66,472, a difference of 0.53%), Cypriot ($65,549, a difference of 0.88%), Immigrants from Japan ($65,518, a difference of 0.93%), and Immigrants from Sweden ($65,406, a difference of 1.1%).
| Demographics | Rating | Rank | Median Male Earnings |
| Immigrants | Israel | 100.0 /100 | #10 | Exceptional $68,716 |
| Immigrants | Ireland | 100.0 /100 | #11 | Exceptional $67,698 |
| Immigrants | Australia | 100.0 /100 | #12 | Exceptional $67,634 |
| Immigrants | China | 100.0 /100 | #13 | Exceptional $67,353 |
| Okinawans | 100.0 /100 | #14 | Exceptional $67,232 |
| Immigrants | Eastern Asia | 100.0 /100 | #15 | Exceptional $66,903 |
| Eastern Europeans | 100.0 /100 | #16 | Exceptional $66,472 |
| Immigrants | Belgium | 100.0 /100 | #17 | Exceptional $66,125 |
| Indians (Asian) | 100.0 /100 | #18 | Exceptional $66,078 |
| Cypriots | 100.0 /100 | #19 | Exceptional $65,549 |
| Immigrants | Japan | 100.0 /100 | #20 | Exceptional $65,518 |
| Immigrants | Sweden | 100.0 /100 | #21 | Exceptional $65,406 |
| Burmese | 100.0 /100 | #22 | Exceptional $65,236 |
| Immigrants | Korea | 100.0 /100 | #23 | Exceptional $65,079 |
| Immigrants | Northern Europe | 100.0 /100 | #24 | Exceptional $64,987 |
Demographics Similar to Immigrants from Grenada by Median Male Earnings
In terms of median male earnings, the demographic groups most similar to Immigrants from Grenada are Osage ($50,292, a difference of 0.020%), Immigrants from Burma/Myanmar ($50,298, a difference of 0.040%), Immigrants from Guyana ($50,321, a difference of 0.080%), Subsaharan African ($50,408, a difference of 0.26%), and Immigrants from Ecuador ($50,474, a difference of 0.39%).
| Demographics | Rating | Rank | Median Male Earnings |
| Houma | 2.0 /100 | #244 | Tragic $50,547 |
| Hawaiians | 1.9 /100 | #245 | Tragic $50,488 |
| Immigrants | Ecuador | 1.9 /100 | #246 | Tragic $50,474 |
| Sub-Saharan Africans | 1.8 /100 | #247 | Tragic $50,408 |
| Immigrants | Guyana | 1.6 /100 | #248 | Tragic $50,321 |
| Immigrants | Burma/Myanmar | 1.6 /100 | #249 | Tragic $50,298 |
| Osage | 1.6 /100 | #250 | Tragic $50,292 |
| Immigrants | Grenada | 1.6 /100 | #251 | Tragic $50,279 |
| Immigrants | Cabo Verde | 1.2 /100 | #252 | Tragic $50,009 |
| German Russians | 1.1 /100 | #253 | Tragic $49,924 |
| Senegalese | 1.0 /100 | #254 | Tragic $49,774 |
| Alaskan Athabascans | 0.9 /100 | #255 | Tragic $49,748 |
| Alaska Natives | 0.9 /100 | #256 | Tragic $49,711 |
| British West Indians | 0.8 /100 | #257 | Tragic $49,636 |
| Cree | 0.7 /100 | #258 | Tragic $49,497 |