Immigrants from Belarus vs Portuguese 3 or more Vehicles in Household
COMPARE
Immigrants from Belarus
Portuguese
3 or more Vehicles in Household
3 or more Vehicles in Household Comparison
Immigrants from Belarus
Portuguese
15.5%
3 OR MORE VEHICLES IN HOUSEHOLD
0.0/ 100
METRIC RATING
314th/ 347
METRIC RANK
21.8%
3 OR MORE VEHICLES IN HOUSEHOLD
99.8/ 100
METRIC RATING
72nd/ 347
METRIC RANK
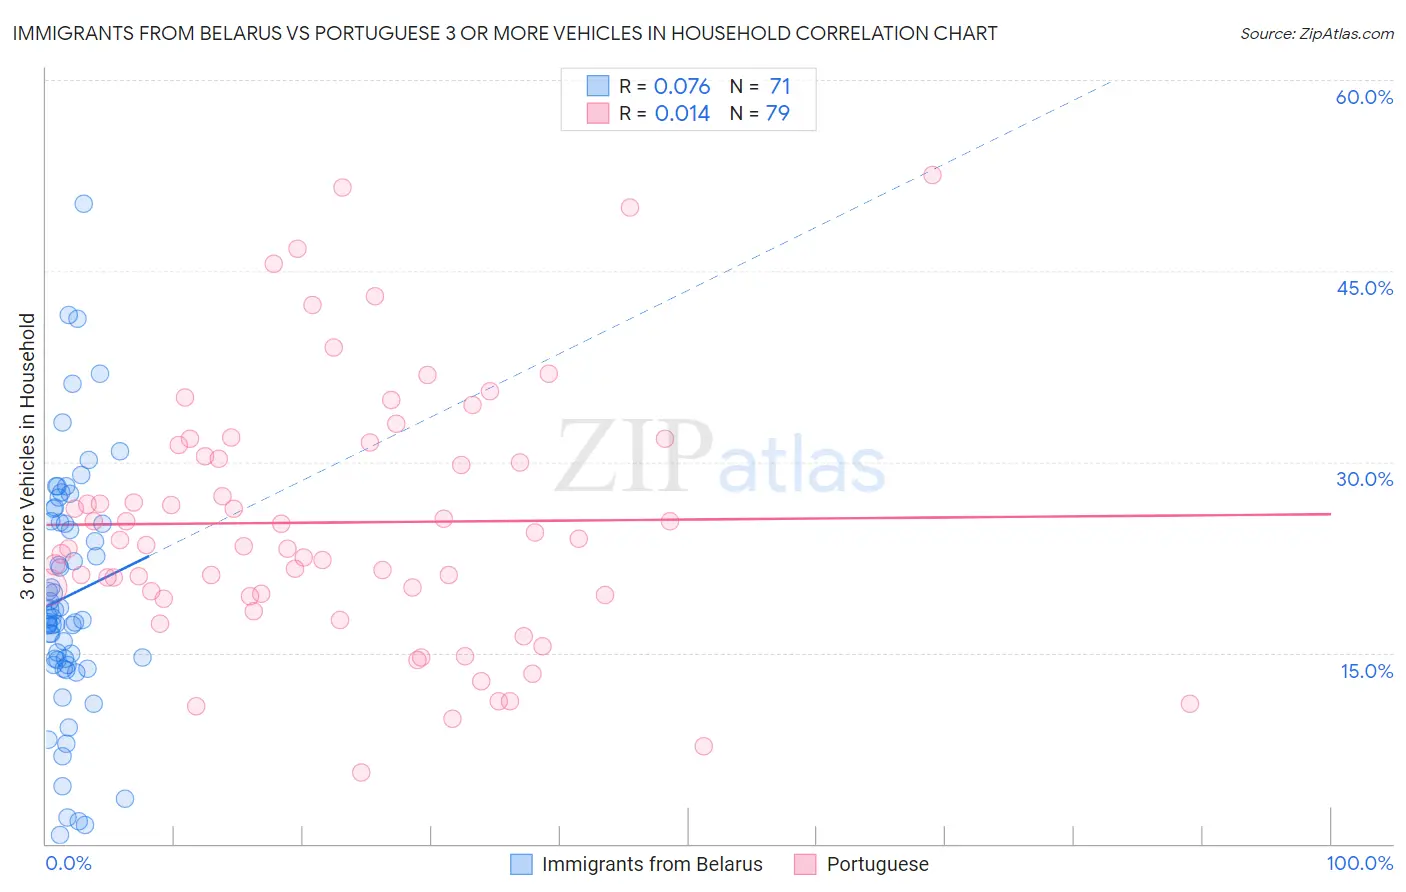
Immigrants from Belarus vs Portuguese 3 or more Vehicles in Household Correlation Chart
The statistical analysis conducted on geographies consisting of 150,160,062 people shows a slight positive correlation between the proportion of Immigrants from Belarus and percentage of households with 3 or more vehicles available in the United States with a correlation coefficient (R) of 0.076 and weighted average of 15.5%. Similarly, the statistical analysis conducted on geographies consisting of 449,850,335 people shows no correlation between the proportion of Portuguese and percentage of households with 3 or more vehicles available in the United States with a correlation coefficient (R) of 0.014 and weighted average of 21.8%, a difference of 40.6%.
3 or more Vehicles in Household Correlation Summary
| Measurement | Immigrants from Belarus | Portuguese |
| Minimum | 0.69% | 5.6% |
| Maximum | 50.3% | 52.5% |
| Range | 49.6% | 46.9% |
| Mean | 19.5% | 25.2% |
| Median | 17.8% | 23.5% |
| Interquartile 25% (IQ1) | 14.1% | 19.5% |
| Interquartile 75% (IQ3) | 25.4% | 31.3% |
| Interquartile Range (IQR) | 11.3% | 11.8% |
| Standard Deviation (Sample) | 9.7% | 10.1% |
| Standard Deviation (Population) | 9.6% | 10.0% |
Similar Demographics by 3 or more Vehicles in Household
Demographics Similar to Immigrants from Belarus by 3 or more Vehicles in Household
In terms of 3 or more vehicles in household, the demographic groups most similar to Immigrants from Belarus are Haitian (15.5%, a difference of 0.32%), Immigrants from Israel (15.6%, a difference of 0.64%), Puerto Rican (15.6%, a difference of 0.66%), U.S. Virgin Islander (15.4%, a difference of 0.84%), and Albanian (15.8%, a difference of 1.8%).
| Demographics | Rating | Rank | 3 or more Vehicles in Household |
| Immigrants | Ghana | 0.0 /100 | #307 | Tragic 16.2% |
| Houma | 0.0 /100 | #308 | Tragic 16.1% |
| Immigrants | Somalia | 0.0 /100 | #309 | Tragic 15.9% |
| Moroccans | 0.0 /100 | #310 | Tragic 15.9% |
| Albanians | 0.0 /100 | #311 | Tragic 15.8% |
| Puerto Ricans | 0.0 /100 | #312 | Tragic 15.6% |
| Immigrants | Israel | 0.0 /100 | #313 | Tragic 15.6% |
| Immigrants | Belarus | 0.0 /100 | #314 | Tragic 15.5% |
| Haitians | 0.0 /100 | #315 | Tragic 15.5% |
| U.S. Virgin Islanders | 0.0 /100 | #316 | Tragic 15.4% |
| Jamaicans | 0.0 /100 | #317 | Tragic 15.2% |
| Immigrants | Haiti | 0.0 /100 | #318 | Tragic 15.2% |
| Cape Verdeans | 0.0 /100 | #319 | Tragic 15.0% |
| Yup'ik | 0.0 /100 | #320 | Tragic 14.8% |
| Immigrants | Jamaica | 0.0 /100 | #321 | Tragic 14.7% |
Demographics Similar to Portuguese by 3 or more Vehicles in Household
In terms of 3 or more vehicles in household, the demographic groups most similar to Portuguese are Salvadoran (21.8%, a difference of 0.090%), Immigrants from Oceania (21.8%, a difference of 0.11%), Potawatomi (21.9%, a difference of 0.18%), Bangladeshi (21.9%, a difference of 0.19%), and Japanese (21.8%, a difference of 0.21%).
| Demographics | Rating | Rank | 3 or more Vehicles in Household |
| Pima | 99.9 /100 | #65 | Exceptional 22.0% |
| Northern Europeans | 99.9 /100 | #66 | Exceptional 22.0% |
| Alaskan Athabascans | 99.9 /100 | #67 | Exceptional 21.9% |
| British | 99.9 /100 | #68 | Exceptional 21.9% |
| Creek | 99.9 /100 | #69 | Exceptional 21.9% |
| Bangladeshis | 99.8 /100 | #70 | Exceptional 21.9% |
| Potawatomi | 99.8 /100 | #71 | Exceptional 21.9% |
| Portuguese | 99.8 /100 | #72 | Exceptional 21.8% |
| Salvadorans | 99.8 /100 | #73 | Exceptional 21.8% |
| Immigrants | Oceania | 99.8 /100 | #74 | Exceptional 21.8% |
| Japanese | 99.8 /100 | #75 | Exceptional 21.8% |
| Immigrants | Nonimmigrants | 99.8 /100 | #76 | Exceptional 21.8% |
| Irish | 99.8 /100 | #77 | Exceptional 21.8% |
| Czechoslovakians | 99.8 /100 | #78 | Exceptional 21.7% |
| Assyrians/Chaldeans/Syriacs | 99.8 /100 | #79 | Exceptional 21.7% |