Immigrants from Belarus vs Immigrants from Ireland 3 or more Vehicles in Household
COMPARE
Immigrants from Belarus
Immigrants from Ireland
3 or more Vehicles in Household
3 or more Vehicles in Household Comparison
Immigrants from Belarus
Immigrants from Ireland
15.5%
3 OR MORE VEHICLES IN HOUSEHOLD
0.0/ 100
METRIC RATING
314th/ 347
METRIC RANK
17.3%
3 OR MORE VEHICLES IN HOUSEHOLD
0.3/ 100
METRIC RATING
282nd/ 347
METRIC RANK
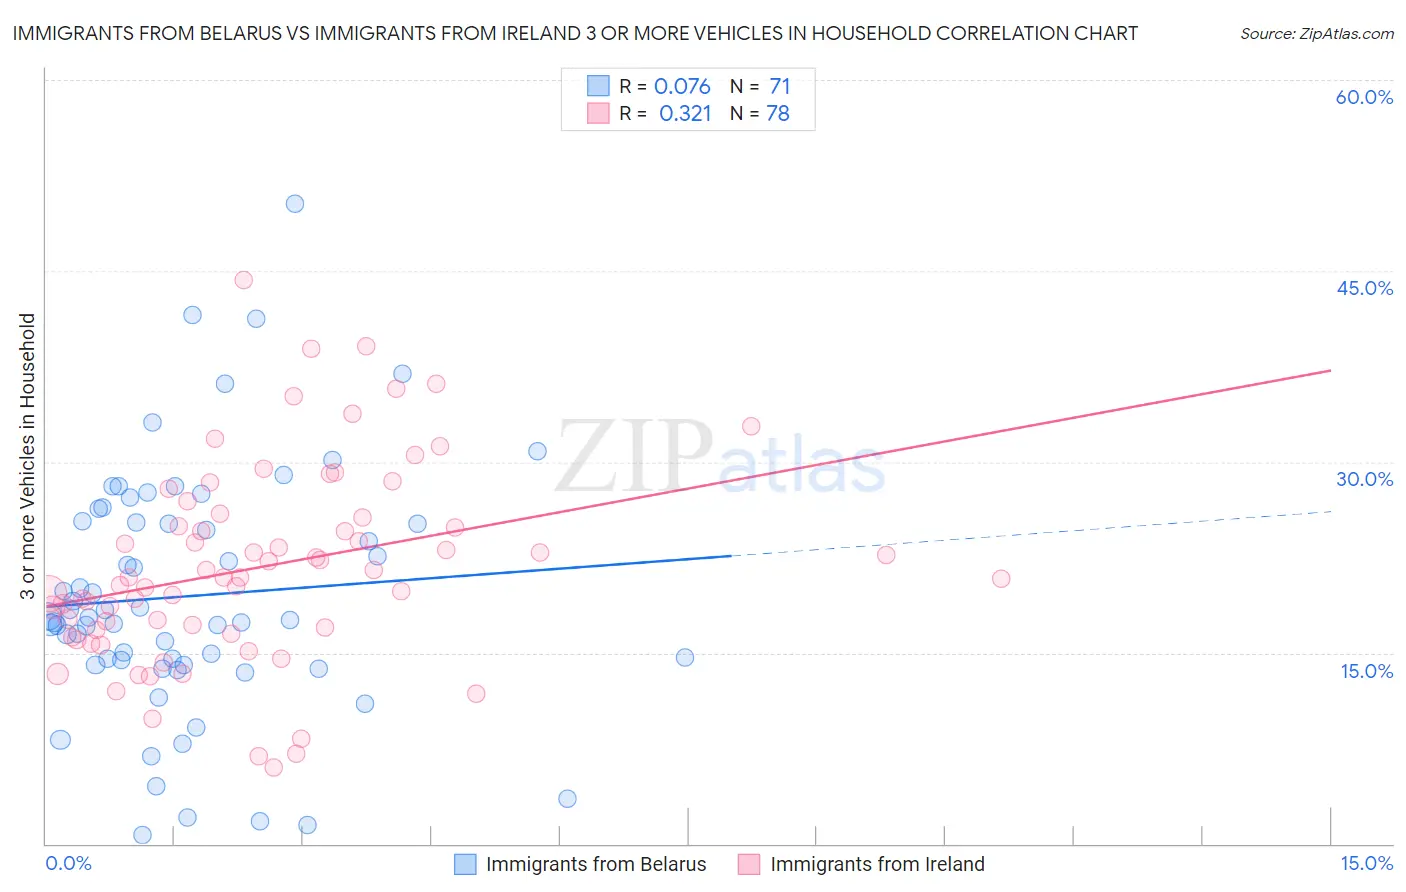
Immigrants from Belarus vs Immigrants from Ireland 3 or more Vehicles in Household Correlation Chart
The statistical analysis conducted on geographies consisting of 150,160,062 people shows a slight positive correlation between the proportion of Immigrants from Belarus and percentage of households with 3 or more vehicles available in the United States with a correlation coefficient (R) of 0.076 and weighted average of 15.5%. Similarly, the statistical analysis conducted on geographies consisting of 240,727,635 people shows a mild positive correlation between the proportion of Immigrants from Ireland and percentage of households with 3 or more vehicles available in the United States with a correlation coefficient (R) of 0.321 and weighted average of 17.3%, a difference of 11.7%.
3 or more Vehicles in Household Correlation Summary
| Measurement | Immigrants from Belarus | Immigrants from Ireland |
| Minimum | 0.69% | 6.0% |
| Maximum | 50.3% | 44.3% |
| Range | 49.6% | 38.3% |
| Mean | 19.5% | 21.7% |
| Median | 17.8% | 20.9% |
| Interquartile 25% (IQ1) | 14.1% | 16.8% |
| Interquartile 75% (IQ3) | 25.4% | 25.6% |
| Interquartile Range (IQR) | 11.3% | 8.8% |
| Standard Deviation (Sample) | 9.7% | 7.8% |
| Standard Deviation (Population) | 9.6% | 7.7% |
Similar Demographics by 3 or more Vehicles in Household
Demographics Similar to Immigrants from Belarus by 3 or more Vehicles in Household
In terms of 3 or more vehicles in household, the demographic groups most similar to Immigrants from Belarus are Haitian (15.5%, a difference of 0.32%), Immigrants from Israel (15.6%, a difference of 0.64%), Puerto Rican (15.6%, a difference of 0.66%), U.S. Virgin Islander (15.4%, a difference of 0.84%), and Albanian (15.8%, a difference of 1.8%).
| Demographics | Rating | Rank | 3 or more Vehicles in Household |
| Immigrants | Ghana | 0.0 /100 | #307 | Tragic 16.2% |
| Houma | 0.0 /100 | #308 | Tragic 16.1% |
| Immigrants | Somalia | 0.0 /100 | #309 | Tragic 15.9% |
| Moroccans | 0.0 /100 | #310 | Tragic 15.9% |
| Albanians | 0.0 /100 | #311 | Tragic 15.8% |
| Puerto Ricans | 0.0 /100 | #312 | Tragic 15.6% |
| Immigrants | Israel | 0.0 /100 | #313 | Tragic 15.6% |
| Immigrants | Belarus | 0.0 /100 | #314 | Tragic 15.5% |
| Haitians | 0.0 /100 | #315 | Tragic 15.5% |
| U.S. Virgin Islanders | 0.0 /100 | #316 | Tragic 15.4% |
| Jamaicans | 0.0 /100 | #317 | Tragic 15.2% |
| Immigrants | Haiti | 0.0 /100 | #318 | Tragic 15.2% |
| Cape Verdeans | 0.0 /100 | #319 | Tragic 15.0% |
| Yup'ik | 0.0 /100 | #320 | Tragic 14.8% |
| Immigrants | Jamaica | 0.0 /100 | #321 | Tragic 14.7% |
Demographics Similar to Immigrants from Ireland by 3 or more Vehicles in Household
In terms of 3 or more vehicles in household, the demographic groups most similar to Immigrants from Ireland are Black/African American (17.3%, a difference of 0.050%), Immigrants from Colombia (17.3%, a difference of 0.17%), Immigrants from Latvia (17.4%, a difference of 0.29%), Immigrants from Eastern Europe (17.4%, a difference of 0.33%), and Immigrants from Kazakhstan (17.4%, a difference of 0.37%).
| Demographics | Rating | Rank | 3 or more Vehicles in Household |
| Immigrants | Ukraine | 0.4 /100 | #275 | Tragic 17.5% |
| Okinawans | 0.4 /100 | #276 | Tragic 17.4% |
| Brazilians | 0.4 /100 | #277 | Tragic 17.4% |
| Immigrants | Bahamas | 0.3 /100 | #278 | Tragic 17.4% |
| Immigrants | Kazakhstan | 0.3 /100 | #279 | Tragic 17.4% |
| Immigrants | Eastern Europe | 0.3 /100 | #280 | Tragic 17.4% |
| Immigrants | Latvia | 0.3 /100 | #281 | Tragic 17.4% |
| Immigrants | Ireland | 0.3 /100 | #282 | Tragic 17.3% |
| Blacks/African Americans | 0.3 /100 | #283 | Tragic 17.3% |
| Immigrants | Colombia | 0.3 /100 | #284 | Tragic 17.3% |
| Immigrants | Croatia | 0.2 /100 | #285 | Tragic 17.2% |
| Menominee | 0.2 /100 | #286 | Tragic 17.2% |
| Immigrants | Brazil | 0.2 /100 | #287 | Tragic 17.1% |
| Immigrants | Uruguay | 0.2 /100 | #288 | Tragic 17.1% |
| Immigrants | Liberia | 0.1 /100 | #289 | Tragic 17.1% |