Immigrants from Belarus vs Portuguese Bachelor's Degree
COMPARE
Immigrants from Belarus
Portuguese
Bachelor's Degree
Bachelor's Degree Comparison
Immigrants from Belarus
Portuguese
45.0%
BACHELOR'S DEGREE
100.0/ 100
METRIC RATING
40th/ 347
METRIC RANK
35.5%
BACHELOR'S DEGREE
7.2/ 100
METRIC RATING
226th/ 347
METRIC RANK
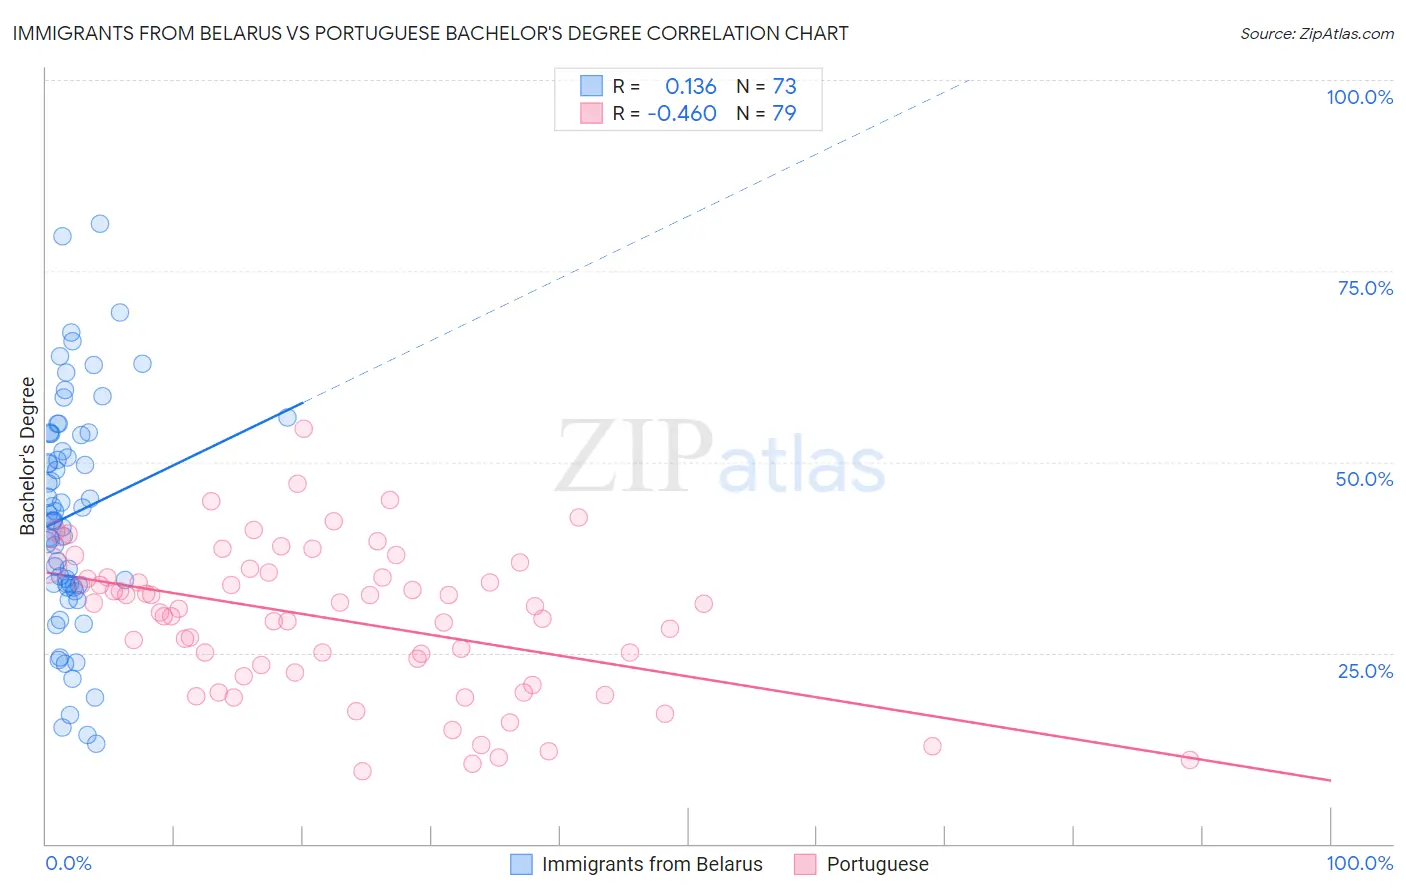
Immigrants from Belarus vs Portuguese Bachelor's Degree Correlation Chart
The statistical analysis conducted on geographies consisting of 150,192,988 people shows a poor positive correlation between the proportion of Immigrants from Belarus and percentage of population with at least bachelor's degree education in the United States with a correlation coefficient (R) of 0.136 and weighted average of 45.0%. Similarly, the statistical analysis conducted on geographies consisting of 450,314,752 people shows a moderate negative correlation between the proportion of Portuguese and percentage of population with at least bachelor's degree education in the United States with a correlation coefficient (R) of -0.460 and weighted average of 35.5%, a difference of 26.9%.
Bachelor's Degree Correlation Summary
| Measurement | Immigrants from Belarus | Portuguese |
| Minimum | 13.1% | 9.4% |
| Maximum | 81.2% | 54.4% |
| Range | 68.1% | 45.0% |
| Mean | 43.1% | 29.4% |
| Median | 42.3% | 31.1% |
| Interquartile 25% (IQ1) | 33.8% | 22.5% |
| Interquartile 75% (IQ3) | 53.7% | 35.6% |
| Interquartile Range (IQR) | 19.9% | 13.1% |
| Standard Deviation (Sample) | 14.8% | 9.6% |
| Standard Deviation (Population) | 14.7% | 9.5% |
Similar Demographics by Bachelor's Degree
Demographics Similar to Immigrants from Belarus by Bachelor's Degree
In terms of bachelor's degree, the demographic groups most similar to Immigrants from Belarus are Immigrants from Malaysia (45.0%, a difference of 0.040%), Immigrants from Latvia (45.1%, a difference of 0.27%), Immigrants from Saudi Arabia (44.8%, a difference of 0.42%), Immigrants from South Africa (44.8%, a difference of 0.56%), and Bulgarian (45.3%, a difference of 0.60%).
| Demographics | Rating | Rank | Bachelor's Degree |
| Immigrants | Northern Europe | 100.0 /100 | #33 | Exceptional 45.6% |
| Immigrants | Denmark | 100.0 /100 | #34 | Exceptional 45.4% |
| Immigrants | Russia | 100.0 /100 | #35 | Exceptional 45.4% |
| Mongolians | 100.0 /100 | #36 | Exceptional 45.4% |
| Russians | 100.0 /100 | #37 | Exceptional 45.3% |
| Bulgarians | 100.0 /100 | #38 | Exceptional 45.3% |
| Immigrants | Latvia | 100.0 /100 | #39 | Exceptional 45.1% |
| Immigrants | Belarus | 100.0 /100 | #40 | Exceptional 45.0% |
| Immigrants | Malaysia | 100.0 /100 | #41 | Exceptional 45.0% |
| Immigrants | Saudi Arabia | 100.0 /100 | #42 | Exceptional 44.8% |
| Immigrants | South Africa | 99.9 /100 | #43 | Exceptional 44.8% |
| Immigrants | Lithuania | 99.9 /100 | #44 | Exceptional 44.6% |
| Immigrants | Kuwait | 99.9 /100 | #45 | Exceptional 44.6% |
| Immigrants | Bulgaria | 99.9 /100 | #46 | Exceptional 44.6% |
| Bolivians | 99.9 /100 | #47 | Exceptional 44.6% |
Demographics Similar to Portuguese by Bachelor's Degree
In terms of bachelor's degree, the demographic groups most similar to Portuguese are Immigrants from Burma/Myanmar (35.5%, a difference of 0.040%), Immigrants from Barbados (35.5%, a difference of 0.11%), Ecuadorian (35.4%, a difference of 0.26%), French Canadian (35.6%, a difference of 0.38%), and Immigrants from Trinidad and Tobago (35.3%, a difference of 0.49%).
| Demographics | Rating | Rank | Bachelor's Degree |
| West Indians | 9.7 /100 | #219 | Tragic 35.8% |
| Spanish | 9.6 /100 | #220 | Tragic 35.8% |
| Dutch | 9.2 /100 | #221 | Tragic 35.7% |
| Trinidadians and Tobagonians | 8.8 /100 | #222 | Tragic 35.7% |
| French Canadians | 8.3 /100 | #223 | Tragic 35.6% |
| Immigrants | Barbados | 7.5 /100 | #224 | Tragic 35.5% |
| Immigrants | Burma/Myanmar | 7.3 /100 | #225 | Tragic 35.5% |
| Portuguese | 7.2 /100 | #226 | Tragic 35.5% |
| Ecuadorians | 6.6 /100 | #227 | Tragic 35.4% |
| Immigrants | Trinidad and Tobago | 6.0 /100 | #228 | Tragic 35.3% |
| Whites/Caucasians | 5.9 /100 | #229 | Tragic 35.3% |
| Immigrants | Grenada | 4.3 /100 | #230 | Tragic 35.0% |
| Immigrants | St. Vincent and the Grenadines | 4.3 /100 | #231 | Tragic 35.0% |
| Hmong | 3.4 /100 | #232 | Tragic 34.8% |
| Immigrants | Ecuador | 3.3 /100 | #233 | Tragic 34.7% |