Immigrants from Belarus vs Immigrants from Micronesia 3 or more Vehicles in Household
COMPARE
Immigrants from Belarus
Immigrants from Micronesia
3 or more Vehicles in Household
3 or more Vehicles in Household Comparison
Immigrants from Belarus
Immigrants from Micronesia
15.5%
3 OR MORE VEHICLES IN HOUSEHOLD
0.0/ 100
METRIC RATING
314th/ 347
METRIC RANK
20.7%
3 OR MORE VEHICLES IN HOUSEHOLD
96.7/ 100
METRIC RATING
111th/ 347
METRIC RANK
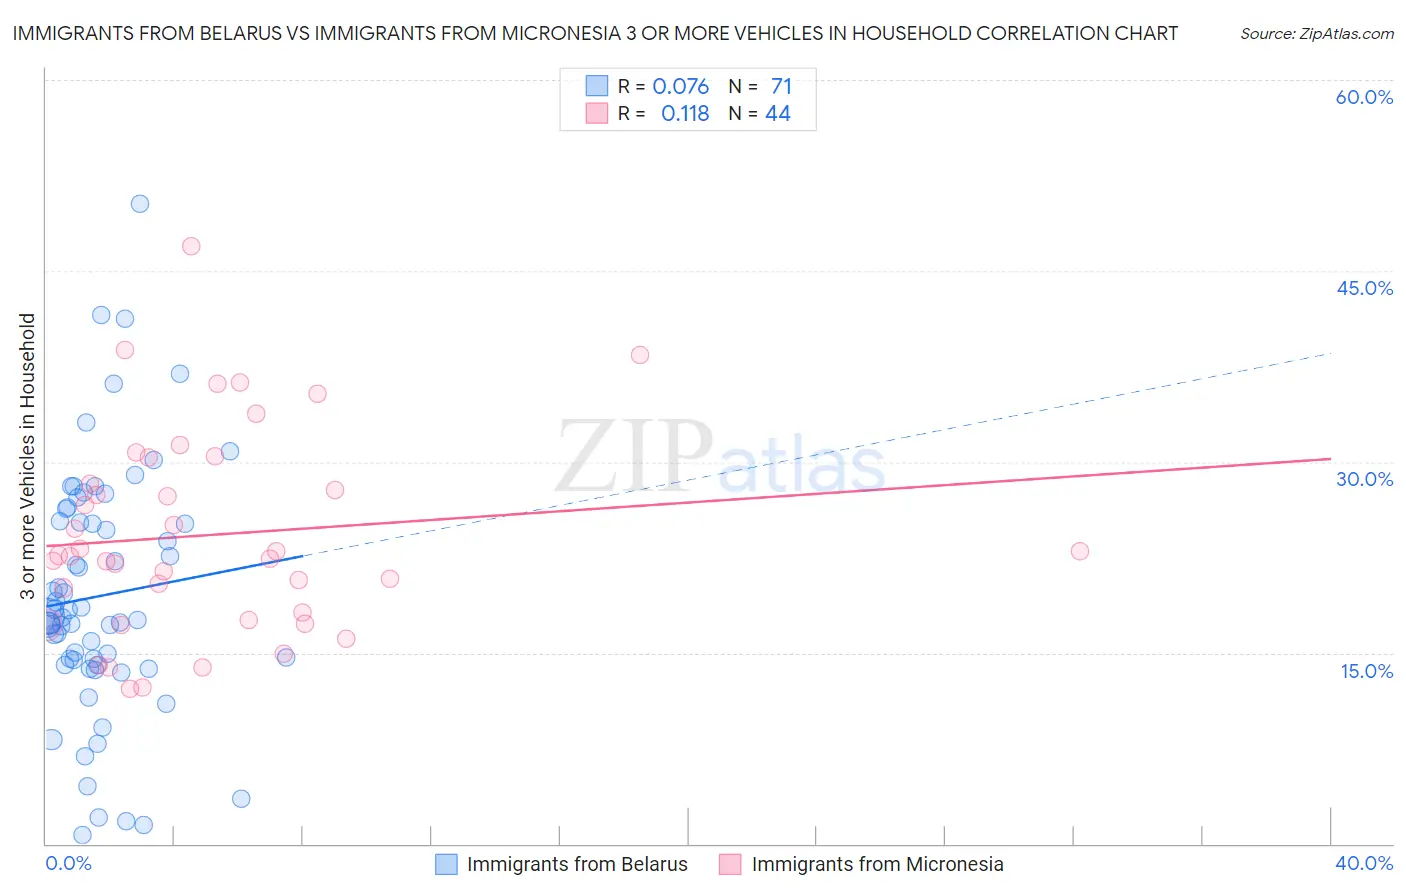
Immigrants from Belarus vs Immigrants from Micronesia 3 or more Vehicles in Household Correlation Chart
The statistical analysis conducted on geographies consisting of 150,160,062 people shows a slight positive correlation between the proportion of Immigrants from Belarus and percentage of households with 3 or more vehicles available in the United States with a correlation coefficient (R) of 0.076 and weighted average of 15.5%. Similarly, the statistical analysis conducted on geographies consisting of 61,601,070 people shows a poor positive correlation between the proportion of Immigrants from Micronesia and percentage of households with 3 or more vehicles available in the United States with a correlation coefficient (R) of 0.118 and weighted average of 20.7%, a difference of 33.7%.
3 or more Vehicles in Household Correlation Summary
| Measurement | Immigrants from Belarus | Immigrants from Micronesia |
| Minimum | 0.69% | 12.1% |
| Maximum | 50.3% | 47.0% |
| Range | 49.6% | 34.8% |
| Mean | 19.5% | 24.2% |
| Median | 17.8% | 22.6% |
| Interquartile 25% (IQ1) | 14.1% | 17.9% |
| Interquartile 75% (IQ3) | 25.4% | 29.3% |
| Interquartile Range (IQR) | 11.3% | 11.4% |
| Standard Deviation (Sample) | 9.7% | 8.0% |
| Standard Deviation (Population) | 9.6% | 7.9% |
Similar Demographics by 3 or more Vehicles in Household
Demographics Similar to Immigrants from Belarus by 3 or more Vehicles in Household
In terms of 3 or more vehicles in household, the demographic groups most similar to Immigrants from Belarus are Haitian (15.5%, a difference of 0.32%), Immigrants from Israel (15.6%, a difference of 0.64%), Puerto Rican (15.6%, a difference of 0.66%), U.S. Virgin Islander (15.4%, a difference of 0.84%), and Albanian (15.8%, a difference of 1.8%).
| Demographics | Rating | Rank | 3 or more Vehicles in Household |
| Immigrants | Ghana | 0.0 /100 | #307 | Tragic 16.2% |
| Houma | 0.0 /100 | #308 | Tragic 16.1% |
| Immigrants | Somalia | 0.0 /100 | #309 | Tragic 15.9% |
| Moroccans | 0.0 /100 | #310 | Tragic 15.9% |
| Albanians | 0.0 /100 | #311 | Tragic 15.8% |
| Puerto Ricans | 0.0 /100 | #312 | Tragic 15.6% |
| Immigrants | Israel | 0.0 /100 | #313 | Tragic 15.6% |
| Immigrants | Belarus | 0.0 /100 | #314 | Tragic 15.5% |
| Haitians | 0.0 /100 | #315 | Tragic 15.5% |
| U.S. Virgin Islanders | 0.0 /100 | #316 | Tragic 15.4% |
| Jamaicans | 0.0 /100 | #317 | Tragic 15.2% |
| Immigrants | Haiti | 0.0 /100 | #318 | Tragic 15.2% |
| Cape Verdeans | 0.0 /100 | #319 | Tragic 15.0% |
| Yup'ik | 0.0 /100 | #320 | Tragic 14.8% |
| Immigrants | Jamaica | 0.0 /100 | #321 | Tragic 14.7% |
Demographics Similar to Immigrants from Micronesia by 3 or more Vehicles in Household
In terms of 3 or more vehicles in household, the demographic groups most similar to Immigrants from Micronesia are Asian (20.8%, a difference of 0.030%), Filipino (20.8%, a difference of 0.17%), Immigrants from Scotland (20.8%, a difference of 0.23%), Nicaraguan (20.7%, a difference of 0.29%), and Immigrants from England (20.7%, a difference of 0.30%).
| Demographics | Rating | Rank | 3 or more Vehicles in Household |
| Luxembourgers | 97.7 /100 | #104 | Exceptional 20.9% |
| Austrians | 97.5 /100 | #105 | Exceptional 20.9% |
| Bolivians | 97.4 /100 | #106 | Exceptional 20.8% |
| Immigrants | Germany | 97.4 /100 | #107 | Exceptional 20.8% |
| Immigrants | Scotland | 97.1 /100 | #108 | Exceptional 20.8% |
| Filipinos | 97.0 /100 | #109 | Exceptional 20.8% |
| Asians | 96.8 /100 | #110 | Exceptional 20.8% |
| Immigrants | Micronesia | 96.7 /100 | #111 | Exceptional 20.7% |
| Nicaraguans | 96.2 /100 | #112 | Exceptional 20.7% |
| Immigrants | England | 96.2 /100 | #113 | Exceptional 20.7% |
| Burmese | 95.8 /100 | #114 | Exceptional 20.6% |
| French Canadians | 95.0 /100 | #115 | Exceptional 20.6% |
| Italians | 94.9 /100 | #116 | Exceptional 20.6% |
| Croatians | 94.9 /100 | #117 | Exceptional 20.6% |
| Costa Ricans | 94.6 /100 | #118 | Exceptional 20.6% |