Immigrants from Belarus vs Finnish 3 or more Vehicles in Household
COMPARE
Immigrants from Belarus
Finnish
3 or more Vehicles in Household
3 or more Vehicles in Household Comparison
Immigrants from Belarus
Finns
15.5%
3 OR MORE VEHICLES IN HOUSEHOLD
0.0/ 100
METRIC RATING
314th/ 347
METRIC RANK
22.3%
3 OR MORE VEHICLES IN HOUSEHOLD
99.9/ 100
METRIC RATING
60th/ 347
METRIC RANK
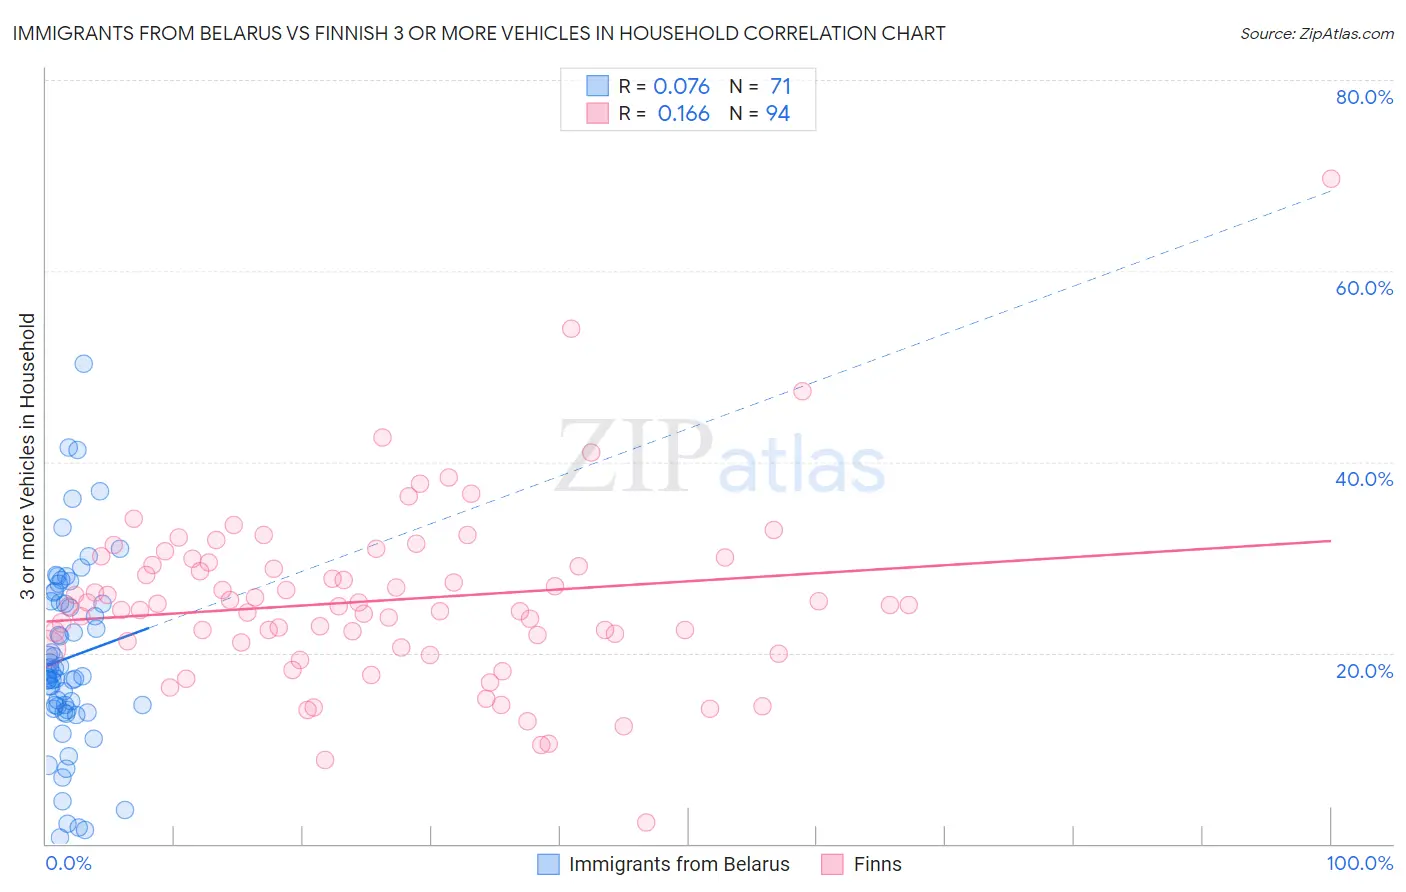
Immigrants from Belarus vs Finnish 3 or more Vehicles in Household Correlation Chart
The statistical analysis conducted on geographies consisting of 150,160,062 people shows a slight positive correlation between the proportion of Immigrants from Belarus and percentage of households with 3 or more vehicles available in the United States with a correlation coefficient (R) of 0.076 and weighted average of 15.5%. Similarly, the statistical analysis conducted on geographies consisting of 404,442,168 people shows a poor positive correlation between the proportion of Finns and percentage of households with 3 or more vehicles available in the United States with a correlation coefficient (R) of 0.166 and weighted average of 22.3%, a difference of 43.6%.
3 or more Vehicles in Household Correlation Summary
| Measurement | Immigrants from Belarus | Finnish |
| Minimum | 0.69% | 2.2% |
| Maximum | 50.3% | 69.6% |
| Range | 49.6% | 67.4% |
| Mean | 19.5% | 25.5% |
| Median | 17.8% | 25.0% |
| Interquartile 25% (IQ1) | 14.1% | 21.1% |
| Interquartile 75% (IQ3) | 25.4% | 29.4% |
| Interquartile Range (IQR) | 11.3% | 8.3% |
| Standard Deviation (Sample) | 9.7% | 9.3% |
| Standard Deviation (Population) | 9.6% | 9.2% |
Similar Demographics by 3 or more Vehicles in Household
Demographics Similar to Immigrants from Belarus by 3 or more Vehicles in Household
In terms of 3 or more vehicles in household, the demographic groups most similar to Immigrants from Belarus are Haitian (15.5%, a difference of 0.32%), Immigrants from Israel (15.6%, a difference of 0.64%), Puerto Rican (15.6%, a difference of 0.66%), U.S. Virgin Islander (15.4%, a difference of 0.84%), and Albanian (15.8%, a difference of 1.8%).
| Demographics | Rating | Rank | 3 or more Vehicles in Household |
| Immigrants | Ghana | 0.0 /100 | #307 | Tragic 16.2% |
| Houma | 0.0 /100 | #308 | Tragic 16.1% |
| Immigrants | Somalia | 0.0 /100 | #309 | Tragic 15.9% |
| Moroccans | 0.0 /100 | #310 | Tragic 15.9% |
| Albanians | 0.0 /100 | #311 | Tragic 15.8% |
| Puerto Ricans | 0.0 /100 | #312 | Tragic 15.6% |
| Immigrants | Israel | 0.0 /100 | #313 | Tragic 15.6% |
| Immigrants | Belarus | 0.0 /100 | #314 | Tragic 15.5% |
| Haitians | 0.0 /100 | #315 | Tragic 15.5% |
| U.S. Virgin Islanders | 0.0 /100 | #316 | Tragic 15.4% |
| Jamaicans | 0.0 /100 | #317 | Tragic 15.2% |
| Immigrants | Haiti | 0.0 /100 | #318 | Tragic 15.2% |
| Cape Verdeans | 0.0 /100 | #319 | Tragic 15.0% |
| Yup'ik | 0.0 /100 | #320 | Tragic 14.8% |
| Immigrants | Jamaica | 0.0 /100 | #321 | Tragic 14.7% |
Demographics Similar to Finns by 3 or more Vehicles in Household
In terms of 3 or more vehicles in household, the demographic groups most similar to Finns are Navajo (22.3%, a difference of 0.090%), Spaniard (22.3%, a difference of 0.15%), Bhutanese (22.2%, a difference of 0.16%), Fijian (22.2%, a difference of 0.20%), and Pennsylvania German (22.3%, a difference of 0.28%).
| Demographics | Rating | Rank | 3 or more Vehicles in Household |
| Czechs | 100.0 /100 | #53 | Exceptional 22.5% |
| Crow | 100.0 /100 | #54 | Exceptional 22.5% |
| Immigrants | Laos | 100.0 /100 | #55 | Exceptional 22.4% |
| Hispanics or Latinos | 100.0 /100 | #56 | Exceptional 22.4% |
| Pennsylvania Germans | 100.0 /100 | #57 | Exceptional 22.3% |
| Spaniards | 100.0 /100 | #58 | Exceptional 22.3% |
| Navajo | 100.0 /100 | #59 | Exceptional 22.3% |
| Finns | 99.9 /100 | #60 | Exceptional 22.3% |
| Bhutanese | 99.9 /100 | #61 | Exceptional 22.2% |
| Fijians | 99.9 /100 | #62 | Exceptional 22.2% |
| Chickasaw | 99.9 /100 | #63 | Exceptional 22.2% |
| Immigrants | Taiwan | 99.9 /100 | #64 | Exceptional 22.1% |
| Pima | 99.9 /100 | #65 | Exceptional 22.0% |
| Northern Europeans | 99.9 /100 | #66 | Exceptional 22.0% |
| Alaskan Athabascans | 99.9 /100 | #67 | Exceptional 21.9% |