Immigrants from Belarus vs Portuguese Disability Age Under 5
COMPARE
Immigrants from Belarus
Portuguese
Disability Age Under 5
Disability Age Under 5 Comparison
Immigrants from Belarus
Portuguese
1.0%
DISABILITY AGE UNDER 5
100.0/ 100
METRIC RATING
29th/ 347
METRIC RANK
1.6%
DISABILITY AGE UNDER 5
0.0/ 100
METRIC RATING
299th/ 347
METRIC RANK
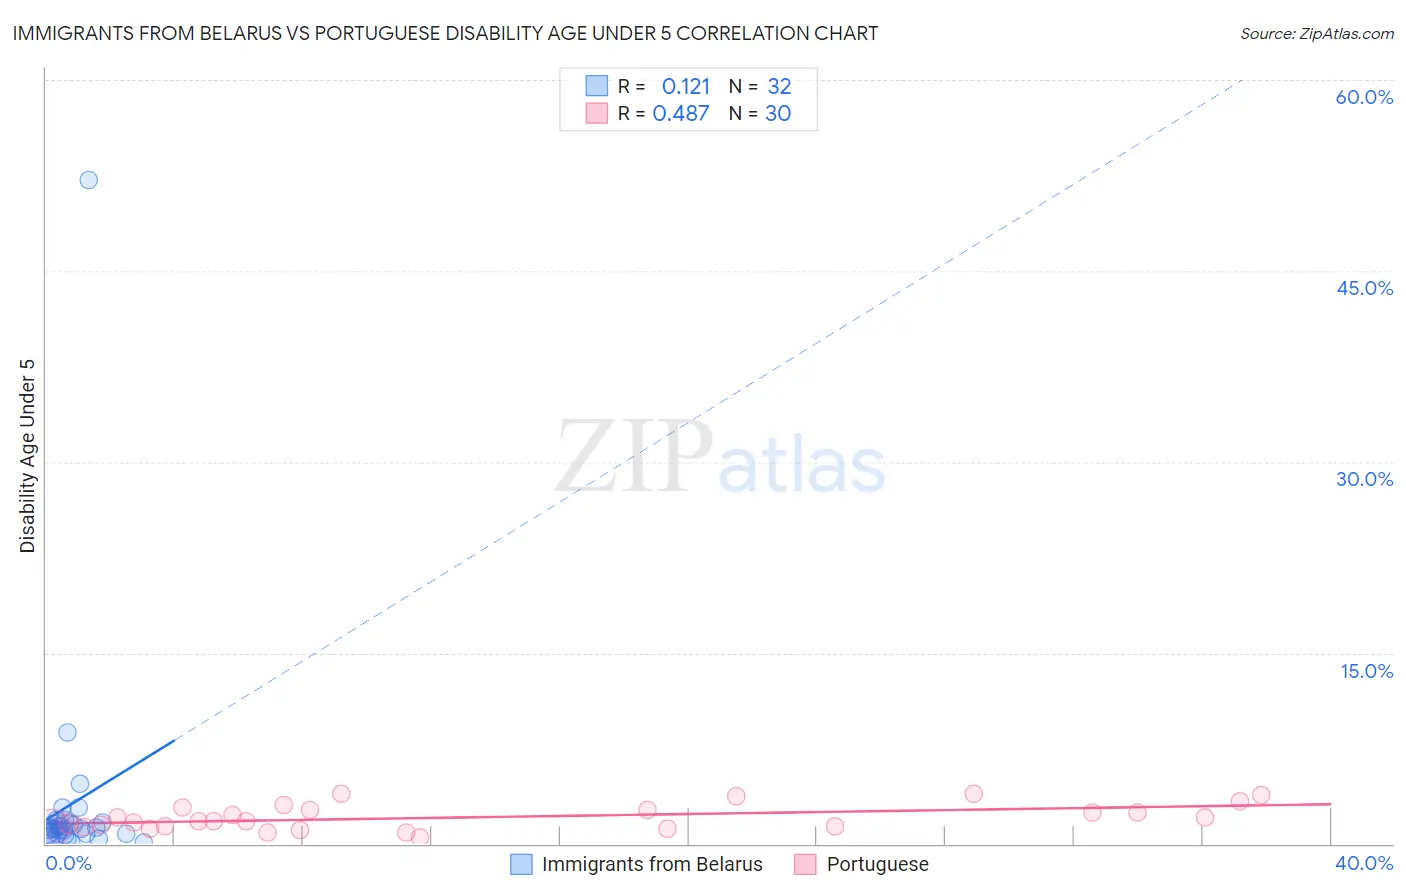
Immigrants from Belarus vs Portuguese Disability Age Under 5 Correlation Chart
The statistical analysis conducted on geographies consisting of 102,408,276 people shows a poor positive correlation between the proportion of Immigrants from Belarus and percentage of population with a disability under the age of 5 in the United States with a correlation coefficient (R) of 0.121 and weighted average of 1.0%. Similarly, the statistical analysis conducted on geographies consisting of 231,785,115 people shows a moderate positive correlation between the proportion of Portuguese and percentage of population with a disability under the age of 5 in the United States with a correlation coefficient (R) of 0.487 and weighted average of 1.6%, a difference of 58.0%.
Disability Age Under 5 Correlation Summary
| Measurement | Immigrants from Belarus | Portuguese |
| Minimum | 0.12% | 0.48% |
| Maximum | 52.1% | 4.0% |
| Range | 52.0% | 3.5% |
| Mean | 3.1% | 2.1% |
| Median | 1.2% | 1.8% |
| Interquartile 25% (IQ1) | 0.78% | 1.3% |
| Interquartile 75% (IQ3) | 1.6% | 2.6% |
| Interquartile Range (IQR) | 0.83% | 1.3% |
| Standard Deviation (Sample) | 9.1% | 0.99% |
| Standard Deviation (Population) | 8.9% | 0.97% |
Similar Demographics by Disability Age Under 5
Demographics Similar to Immigrants from Belarus by Disability Age Under 5
In terms of disability age under 5, the demographic groups most similar to Immigrants from Belarus are Immigrants from Eastern Asia (1.0%, a difference of 0.12%), Immigrants from South Central Asia (1.0%, a difference of 0.52%), Guyanese (1.0%, a difference of 0.76%), Armenian (1.0%, a difference of 0.81%), and Iranian (1.0%, a difference of 0.86%).
| Demographics | Rating | Rank | Disability Age Under 5 |
| Immigrants | Iran | 100.0 /100 | #22 | Exceptional 1.00% |
| Yakama | 100.0 /100 | #23 | Exceptional 1.00% |
| Indians (Asian) | 100.0 /100 | #24 | Exceptional 1.0% |
| Immigrants | Micronesia | 100.0 /100 | #25 | Exceptional 1.0% |
| Immigrants | Taiwan | 100.0 /100 | #26 | Exceptional 1.0% |
| Guyanese | 100.0 /100 | #27 | Exceptional 1.0% |
| Immigrants | Eastern Asia | 100.0 /100 | #28 | Exceptional 1.0% |
| Immigrants | Belarus | 100.0 /100 | #29 | Exceptional 1.0% |
| Immigrants | South Central Asia | 99.9 /100 | #30 | Exceptional 1.0% |
| Armenians | 99.9 /100 | #31 | Exceptional 1.0% |
| Iranians | 99.9 /100 | #32 | Exceptional 1.0% |
| Bolivians | 99.9 /100 | #33 | Exceptional 1.0% |
| Immigrants | Ukraine | 99.9 /100 | #34 | Exceptional 1.0% |
| Barbadians | 99.9 /100 | #35 | Exceptional 1.0% |
| Immigrants | Nepal | 99.9 /100 | #36 | Exceptional 1.0% |
Demographics Similar to Portuguese by Disability Age Under 5
In terms of disability age under 5, the demographic groups most similar to Portuguese are Shoshone (1.6%, a difference of 0.33%), Cajun (1.6%, a difference of 0.57%), Nonimmigrants (1.6%, a difference of 0.58%), German Russian (1.6%, a difference of 0.78%), and Welsh (1.6%, a difference of 0.89%).
| Demographics | Rating | Rank | Disability Age Under 5 |
| Italians | 0.0 /100 | #292 | Tragic 1.6% |
| Lithuanians | 0.0 /100 | #293 | Tragic 1.6% |
| Swedes | 0.0 /100 | #294 | Tragic 1.6% |
| Finns | 0.0 /100 | #295 | Tragic 1.6% |
| Poles | 0.0 /100 | #296 | Tragic 1.6% |
| Immigrants | Nonimmigrants | 0.0 /100 | #297 | Tragic 1.6% |
| Cajuns | 0.0 /100 | #298 | Tragic 1.6% |
| Portuguese | 0.0 /100 | #299 | Tragic 1.6% |
| Shoshone | 0.0 /100 | #300 | Tragic 1.6% |
| German Russians | 0.0 /100 | #301 | Tragic 1.6% |
| Welsh | 0.0 /100 | #302 | Tragic 1.6% |
| Swiss | 0.0 /100 | #303 | Tragic 1.6% |
| Seminole | 0.0 /100 | #304 | Tragic 1.6% |
| Blackfeet | 0.0 /100 | #305 | Tragic 1.6% |
| Creek | 0.0 /100 | #306 | Tragic 1.6% |