Hungarian vs Immigrants from Netherlands 2 or more Vehicles in Household
COMPARE
Hungarian
Immigrants from Netherlands
2 or more Vehicles in Household
2 or more Vehicles in Household Comparison
Hungarians
Immigrants from Netherlands
56.5%
2 OR MORE VEHICLES IN HOUSEHOLD
89.1/ 100
METRIC RATING
132nd/ 347
METRIC RANK
57.5%
2 OR MORE VEHICLES IN HOUSEHOLD
98.2/ 100
METRIC RATING
107th/ 347
METRIC RANK
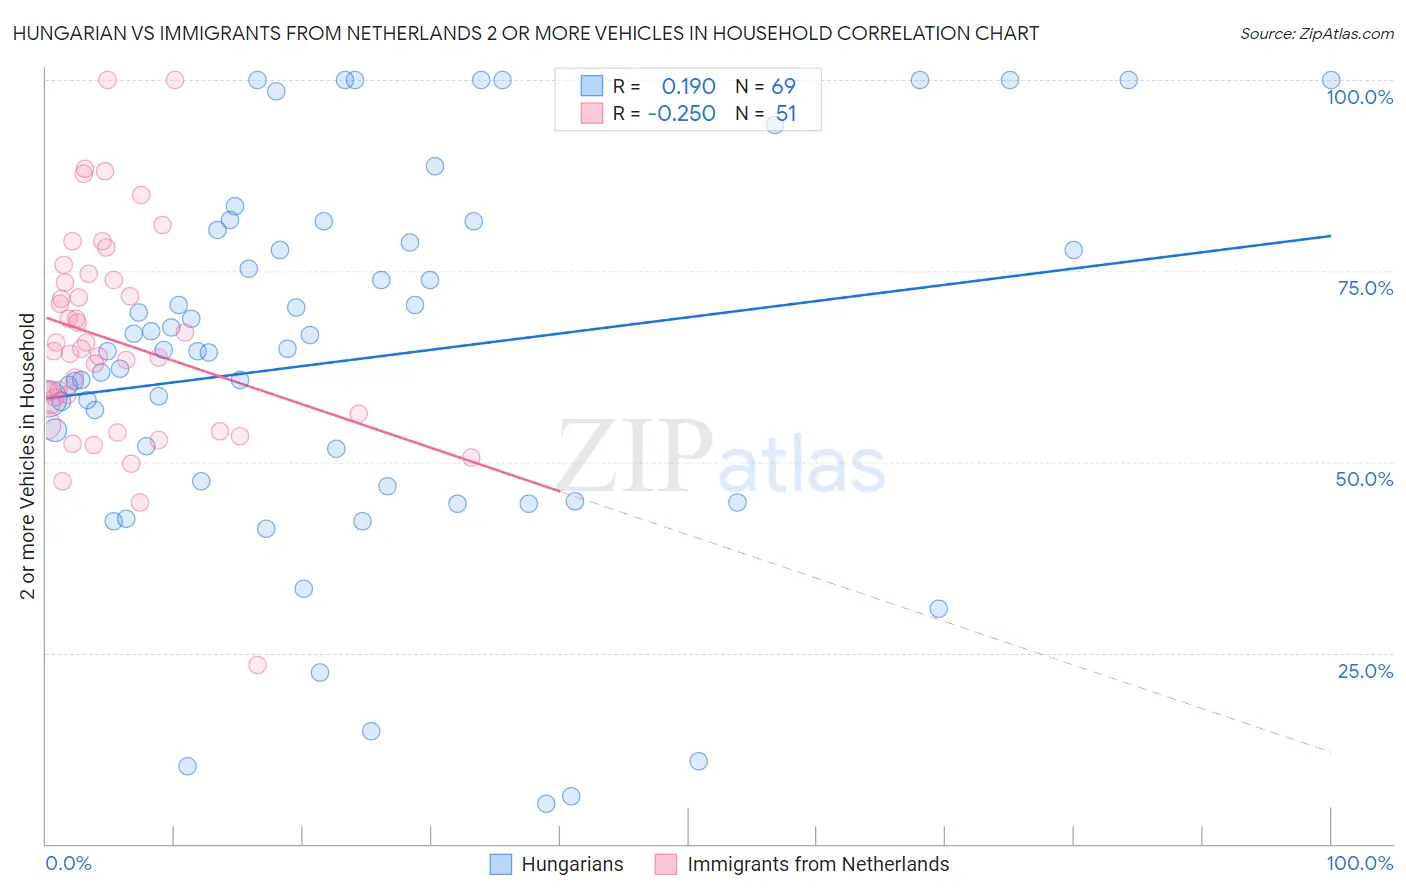
Hungarian vs Immigrants from Netherlands 2 or more Vehicles in Household Correlation Chart
The statistical analysis conducted on geographies consisting of 485,946,107 people shows a poor positive correlation between the proportion of Hungarians and percentage of households with 2 or more vehicles available in the United States with a correlation coefficient (R) of 0.190 and weighted average of 56.5%. Similarly, the statistical analysis conducted on geographies consisting of 237,817,219 people shows a weak negative correlation between the proportion of Immigrants from Netherlands and percentage of households with 2 or more vehicles available in the United States with a correlation coefficient (R) of -0.250 and weighted average of 57.5%, a difference of 1.8%.
2 or more Vehicles in Household Correlation Summary
| Measurement | Hungarian | Immigrants from Netherlands |
| Minimum | 5.2% | 23.3% |
| Maximum | 100.0% | 100.0% |
| Range | 94.8% | 76.7% |
| Mean | 63.4% | 65.9% |
| Median | 64.5% | 64.4% |
| Interquartile 25% (IQ1) | 47.2% | 56.2% |
| Interquartile 75% (IQ3) | 79.5% | 73.9% |
| Interquartile Range (IQR) | 32.4% | 17.6% |
| Standard Deviation (Sample) | 24.4% | 14.1% |
| Standard Deviation (Population) | 24.2% | 14.0% |
Similar Demographics by 2 or more Vehicles in Household
Demographics Similar to Hungarians by 2 or more Vehicles in Household
In terms of 2 or more vehicles in household, the demographic groups most similar to Hungarians are Bulgarian (56.5%, a difference of 0.060%), Comanche (56.5%, a difference of 0.070%), Yugoslavian (56.6%, a difference of 0.090%), Ute (56.6%, a difference of 0.13%), and Immigrants from South Central Asia (56.6%, a difference of 0.15%).
| Demographics | Rating | Rank | 2 or more Vehicles in Household |
| Tsimshian | 91.6 /100 | #125 | Exceptional 56.7% |
| Estonians | 90.9 /100 | #126 | Exceptional 56.6% |
| Immigrants | Thailand | 90.7 /100 | #127 | Exceptional 56.6% |
| Immigrants | South Central Asia | 90.5 /100 | #128 | Exceptional 56.6% |
| Ute | 90.4 /100 | #129 | Exceptional 56.6% |
| Yugoslavians | 90.0 /100 | #130 | Exceptional 56.6% |
| Bulgarians | 89.7 /100 | #131 | Excellent 56.5% |
| Hungarians | 89.1 /100 | #132 | Excellent 56.5% |
| Comanche | 88.4 /100 | #133 | Excellent 56.5% |
| Immigrants | Azores | 86.6 /100 | #134 | Excellent 56.4% |
| Blackfeet | 86.5 /100 | #135 | Excellent 56.4% |
| Immigrants | Asia | 86.0 /100 | #136 | Excellent 56.3% |
| Cubans | 84.8 /100 | #137 | Excellent 56.3% |
| Salvadorans | 84.7 /100 | #138 | Excellent 56.3% |
| Armenians | 84.3 /100 | #139 | Excellent 56.3% |
Demographics Similar to Immigrants from Netherlands by 2 or more Vehicles in Household
In terms of 2 or more vehicles in household, the demographic groups most similar to Immigrants from Netherlands are Immigrants from Canada (57.5%, a difference of 0.010%), Immigrants from Oceania (57.5%, a difference of 0.020%), Immigrants from Korea (57.6%, a difference of 0.030%), Immigrants from Bolivia (57.6%, a difference of 0.040%), and Jordanian (57.6%, a difference of 0.040%).
| Demographics | Rating | Rank | 2 or more Vehicles in Household |
| Fijians | 98.4 /100 | #100 | Exceptional 57.6% |
| Lebanese | 98.3 /100 | #101 | Exceptional 57.6% |
| Immigrants | Bolivia | 98.2 /100 | #102 | Exceptional 57.6% |
| Jordanians | 98.2 /100 | #103 | Exceptional 57.6% |
| Immigrants | Indonesia | 98.2 /100 | #104 | Exceptional 57.6% |
| Immigrants | Korea | 98.2 /100 | #105 | Exceptional 57.6% |
| Immigrants | Oceania | 98.2 /100 | #106 | Exceptional 57.5% |
| Immigrants | Netherlands | 98.2 /100 | #107 | Exceptional 57.5% |
| Immigrants | Canada | 98.1 /100 | #108 | Exceptional 57.5% |
| Immigrants | North America | 98.1 /100 | #109 | Exceptional 57.5% |
| Japanese | 98.0 /100 | #110 | Exceptional 57.5% |
| Greeks | 98.0 /100 | #111 | Exceptional 57.5% |
| Pueblo | 98.0 /100 | #112 | Exceptional 57.5% |
| Zimbabweans | 96.9 /100 | #113 | Exceptional 57.2% |
| Immigrants | Lebanon | 96.8 /100 | #114 | Exceptional 57.2% |