Immigrants from Cabo Verde vs Immigrants from Netherlands 2 or more Vehicles in Household
COMPARE
Immigrants from Cabo Verde
Immigrants from Netherlands
2 or more Vehicles in Household
2 or more Vehicles in Household Comparison
Immigrants from Cabo Verde
Immigrants from Netherlands
43.3%
2 OR MORE VEHICLES IN HOUSEHOLD
0.0/ 100
METRIC RATING
324th/ 347
METRIC RANK
57.5%
2 OR MORE VEHICLES IN HOUSEHOLD
98.2/ 100
METRIC RATING
107th/ 347
METRIC RANK
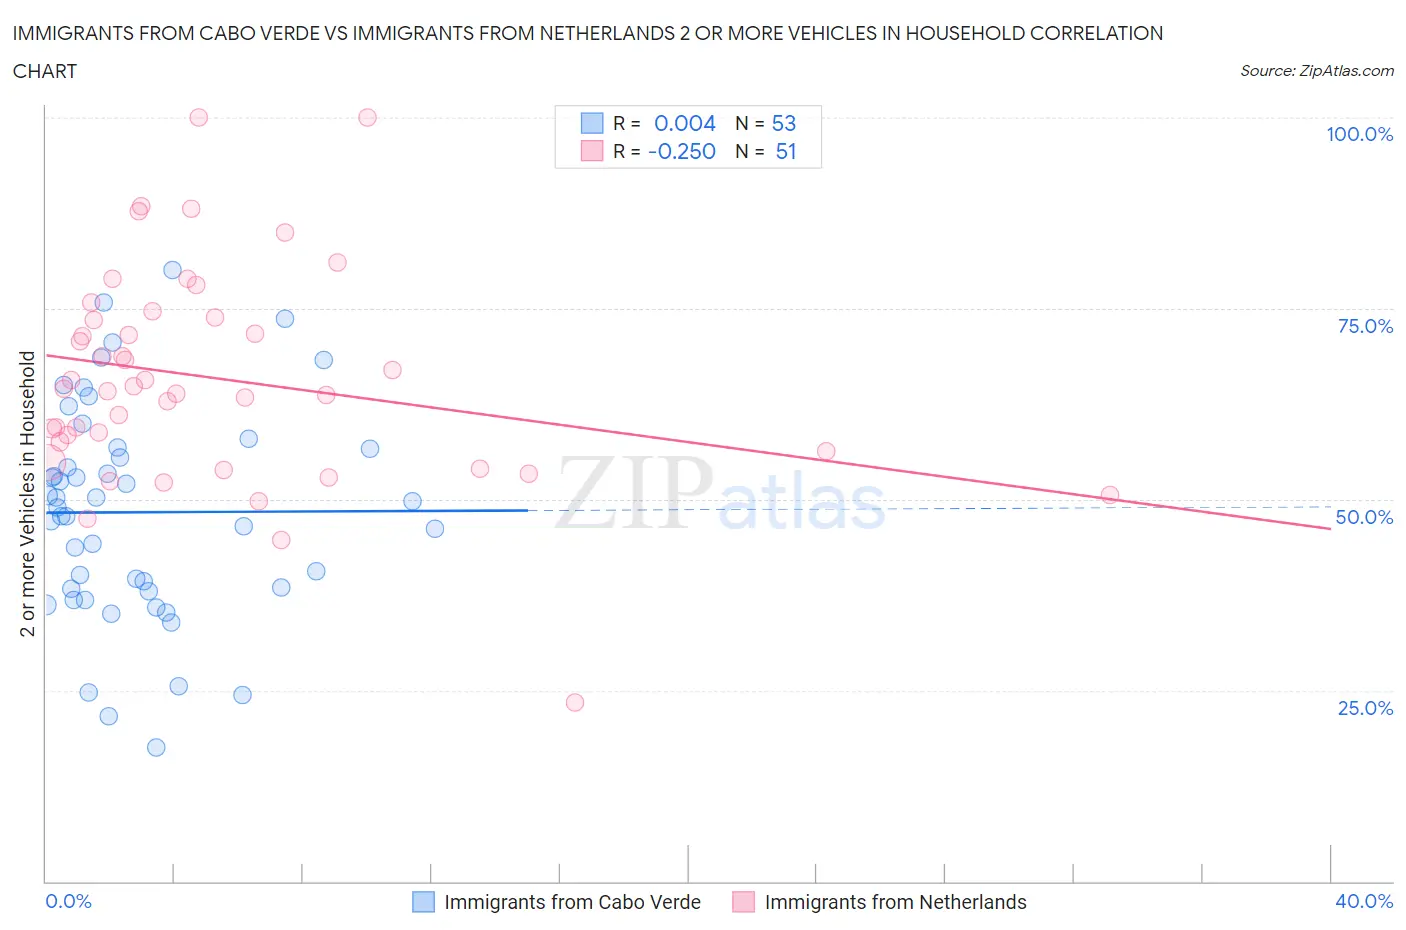
Immigrants from Cabo Verde vs Immigrants from Netherlands 2 or more Vehicles in Household Correlation Chart
The statistical analysis conducted on geographies consisting of 38,145,332 people shows no correlation between the proportion of Immigrants from Cabo Verde and percentage of households with 2 or more vehicles available in the United States with a correlation coefficient (R) of 0.004 and weighted average of 43.3%. Similarly, the statistical analysis conducted on geographies consisting of 237,817,219 people shows a weak negative correlation between the proportion of Immigrants from Netherlands and percentage of households with 2 or more vehicles available in the United States with a correlation coefficient (R) of -0.250 and weighted average of 57.5%, a difference of 32.8%.
2 or more Vehicles in Household Correlation Summary
| Measurement | Immigrants from Cabo Verde | Immigrants from Netherlands |
| Minimum | 17.5% | 23.3% |
| Maximum | 80.1% | 100.0% |
| Range | 62.6% | 76.7% |
| Mean | 48.3% | 65.9% |
| Median | 48.9% | 64.4% |
| Interquartile 25% (IQ1) | 38.1% | 56.2% |
| Interquartile 75% (IQ3) | 56.7% | 73.9% |
| Interquartile Range (IQR) | 18.6% | 17.6% |
| Standard Deviation (Sample) | 14.1% | 14.1% |
| Standard Deviation (Population) | 14.0% | 14.0% |
Similar Demographics by 2 or more Vehicles in Household
Demographics Similar to Immigrants from Cabo Verde by 2 or more Vehicles in Household
In terms of 2 or more vehicles in household, the demographic groups most similar to Immigrants from Cabo Verde are Immigrants from West Indies (43.1%, a difference of 0.57%), Immigrants from Senegal (43.0%, a difference of 0.72%), Immigrants from Yemen (42.8%, a difference of 1.1%), Inupiat (42.6%, a difference of 1.6%), and Immigrants from Caribbean (44.2%, a difference of 2.1%).
| Demographics | Rating | Rank | 2 or more Vehicles in Household |
| Immigrants | Haiti | 0.0 /100 | #317 | Tragic 46.5% |
| Immigrants | Albania | 0.0 /100 | #318 | Tragic 46.0% |
| Jamaicans | 0.0 /100 | #319 | Tragic 45.8% |
| Soviet Union | 0.0 /100 | #320 | Tragic 45.7% |
| Immigrants | Jamaica | 0.0 /100 | #321 | Tragic 44.5% |
| Senegalese | 0.0 /100 | #322 | Tragic 44.2% |
| Immigrants | Caribbean | 0.0 /100 | #323 | Tragic 44.2% |
| Immigrants | Cabo Verde | 0.0 /100 | #324 | Tragic 43.3% |
| Immigrants | West Indies | 0.0 /100 | #325 | Tragic 43.1% |
| Immigrants | Senegal | 0.0 /100 | #326 | Tragic 43.0% |
| Immigrants | Yemen | 0.0 /100 | #327 | Tragic 42.8% |
| Inupiat | 0.0 /100 | #328 | Tragic 42.6% |
| Ecuadorians | 0.0 /100 | #329 | Tragic 42.0% |
| Immigrants | Dominica | 0.0 /100 | #330 | Tragic 41.6% |
| West Indians | 0.0 /100 | #331 | Tragic 41.3% |
Demographics Similar to Immigrants from Netherlands by 2 or more Vehicles in Household
In terms of 2 or more vehicles in household, the demographic groups most similar to Immigrants from Netherlands are Immigrants from Canada (57.5%, a difference of 0.010%), Immigrants from Oceania (57.5%, a difference of 0.020%), Immigrants from Korea (57.6%, a difference of 0.030%), Immigrants from Bolivia (57.6%, a difference of 0.040%), and Jordanian (57.6%, a difference of 0.040%).
| Demographics | Rating | Rank | 2 or more Vehicles in Household |
| Fijians | 98.4 /100 | #100 | Exceptional 57.6% |
| Lebanese | 98.3 /100 | #101 | Exceptional 57.6% |
| Immigrants | Bolivia | 98.2 /100 | #102 | Exceptional 57.6% |
| Jordanians | 98.2 /100 | #103 | Exceptional 57.6% |
| Immigrants | Indonesia | 98.2 /100 | #104 | Exceptional 57.6% |
| Immigrants | Korea | 98.2 /100 | #105 | Exceptional 57.6% |
| Immigrants | Oceania | 98.2 /100 | #106 | Exceptional 57.5% |
| Immigrants | Netherlands | 98.2 /100 | #107 | Exceptional 57.5% |
| Immigrants | Canada | 98.1 /100 | #108 | Exceptional 57.5% |
| Immigrants | North America | 98.1 /100 | #109 | Exceptional 57.5% |
| Japanese | 98.0 /100 | #110 | Exceptional 57.5% |
| Greeks | 98.0 /100 | #111 | Exceptional 57.5% |
| Pueblo | 98.0 /100 | #112 | Exceptional 57.5% |
| Zimbabweans | 96.9 /100 | #113 | Exceptional 57.2% |
| Immigrants | Lebanon | 96.8 /100 | #114 | Exceptional 57.2% |