Immigrants from North Macedonia vs Immigrants from Netherlands 2 or more Vehicles in Household
COMPARE
Immigrants from North Macedonia
Immigrants from Netherlands
2 or more Vehicles in Household
2 or more Vehicles in Household Comparison
Immigrants from North Macedonia
Immigrants from Netherlands
54.4%
2 OR MORE VEHICLES IN HOUSEHOLD
14.9/ 100
METRIC RATING
202nd/ 347
METRIC RANK
57.5%
2 OR MORE VEHICLES IN HOUSEHOLD
98.2/ 100
METRIC RATING
107th/ 347
METRIC RANK
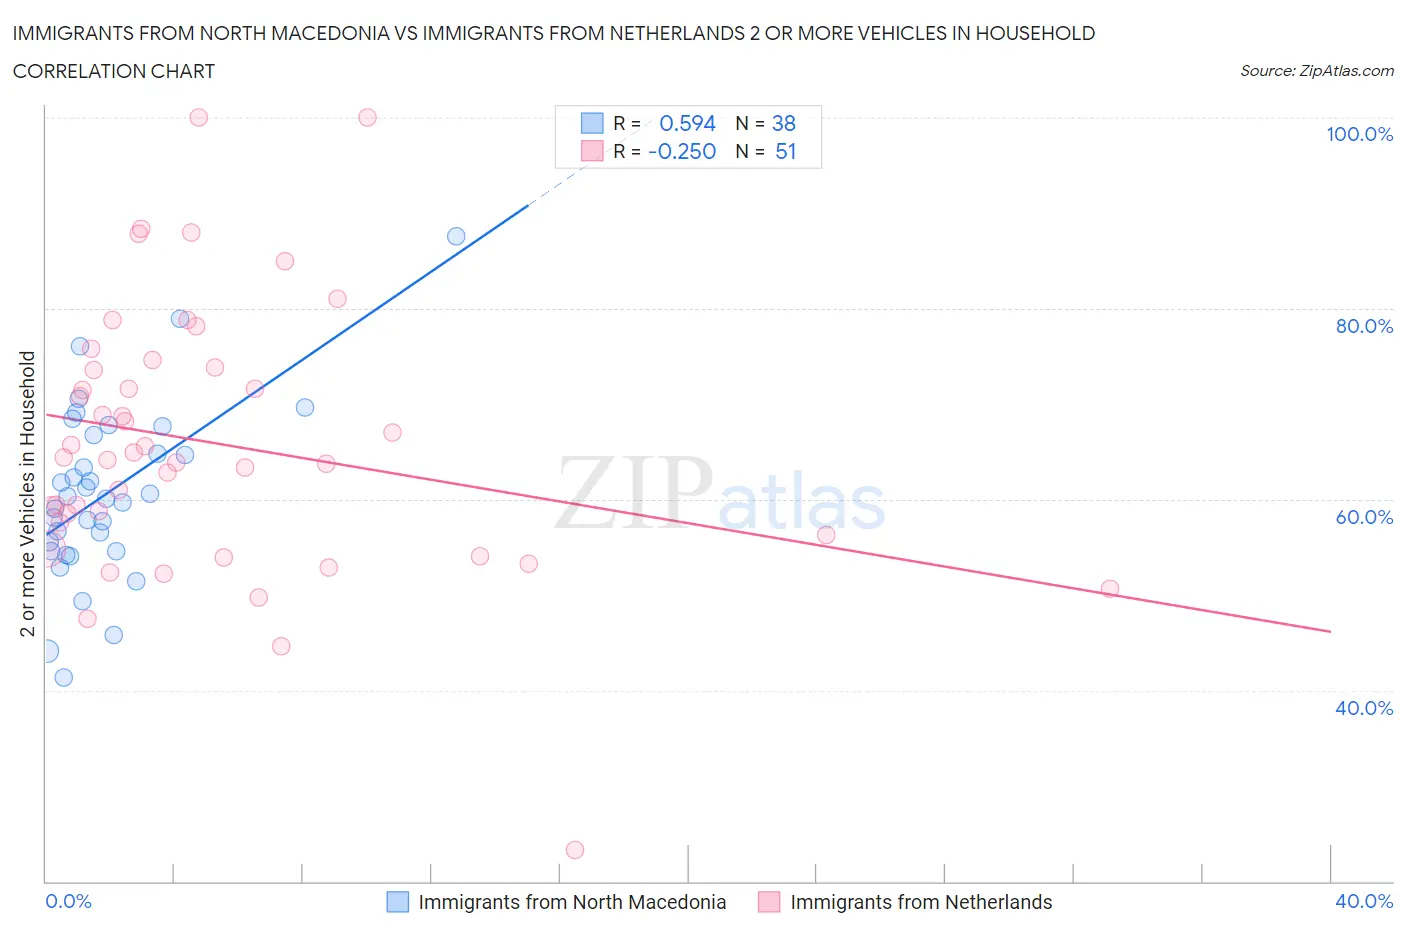
Immigrants from North Macedonia vs Immigrants from Netherlands 2 or more Vehicles in Household Correlation Chart
The statistical analysis conducted on geographies consisting of 74,306,697 people shows a substantial positive correlation between the proportion of Immigrants from North Macedonia and percentage of households with 2 or more vehicles available in the United States with a correlation coefficient (R) of 0.594 and weighted average of 54.4%. Similarly, the statistical analysis conducted on geographies consisting of 237,817,219 people shows a weak negative correlation between the proportion of Immigrants from Netherlands and percentage of households with 2 or more vehicles available in the United States with a correlation coefficient (R) of -0.250 and weighted average of 57.5%, a difference of 5.8%.
2 or more Vehicles in Household Correlation Summary
| Measurement | Immigrants from North Macedonia | Immigrants from Netherlands |
| Minimum | 41.4% | 23.3% |
| Maximum | 87.5% | 100.0% |
| Range | 46.1% | 76.7% |
| Mean | 60.7% | 65.9% |
| Median | 60.2% | 64.4% |
| Interquartile 25% (IQ1) | 54.6% | 56.2% |
| Interquartile 75% (IQ3) | 66.8% | 73.9% |
| Interquartile Range (IQR) | 12.2% | 17.6% |
| Standard Deviation (Sample) | 9.3% | 14.1% |
| Standard Deviation (Population) | 9.1% | 14.0% |
Similar Demographics by 2 or more Vehicles in Household
Demographics Similar to Immigrants from North Macedonia by 2 or more Vehicles in Household
In terms of 2 or more vehicles in household, the demographic groups most similar to Immigrants from North Macedonia are Immigrants from Peru (54.4%, a difference of 0.040%), Immigrants from Italy (54.4%, a difference of 0.050%), Houma (54.4%, a difference of 0.070%), Immigrants from Norway (54.4%, a difference of 0.080%), and Immigrants from Belgium (54.3%, a difference of 0.090%).
| Demographics | Rating | Rank | 2 or more Vehicles in Household |
| Iroquois | 22.6 /100 | #195 | Fair 54.7% |
| Immigrants | Poland | 19.3 /100 | #196 | Poor 54.6% |
| Argentineans | 17.5 /100 | #197 | Poor 54.5% |
| Carpatho Rusyns | 16.2 /100 | #198 | Poor 54.4% |
| Immigrants | Norway | 15.9 /100 | #199 | Poor 54.4% |
| Houma | 15.8 /100 | #200 | Poor 54.4% |
| Immigrants | Italy | 15.5 /100 | #201 | Poor 54.4% |
| Immigrants | North Macedonia | 14.9 /100 | #202 | Poor 54.4% |
| Immigrants | Peru | 14.3 /100 | #203 | Poor 54.4% |
| Immigrants | Belgium | 13.7 /100 | #204 | Poor 54.3% |
| Cheyenne | 13.6 /100 | #205 | Poor 54.3% |
| Immigrants | Latin America | 13.1 /100 | #206 | Poor 54.3% |
| Turks | 13.0 /100 | #207 | Poor 54.3% |
| Egyptians | 12.0 /100 | #208 | Poor 54.3% |
| Immigrants | Bulgaria | 12.0 /100 | #209 | Poor 54.3% |
Demographics Similar to Immigrants from Netherlands by 2 or more Vehicles in Household
In terms of 2 or more vehicles in household, the demographic groups most similar to Immigrants from Netherlands are Immigrants from Canada (57.5%, a difference of 0.010%), Immigrants from Oceania (57.5%, a difference of 0.020%), Immigrants from Korea (57.6%, a difference of 0.030%), Immigrants from Bolivia (57.6%, a difference of 0.040%), and Jordanian (57.6%, a difference of 0.040%).
| Demographics | Rating | Rank | 2 or more Vehicles in Household |
| Fijians | 98.4 /100 | #100 | Exceptional 57.6% |
| Lebanese | 98.3 /100 | #101 | Exceptional 57.6% |
| Immigrants | Bolivia | 98.2 /100 | #102 | Exceptional 57.6% |
| Jordanians | 98.2 /100 | #103 | Exceptional 57.6% |
| Immigrants | Indonesia | 98.2 /100 | #104 | Exceptional 57.6% |
| Immigrants | Korea | 98.2 /100 | #105 | Exceptional 57.6% |
| Immigrants | Oceania | 98.2 /100 | #106 | Exceptional 57.5% |
| Immigrants | Netherlands | 98.2 /100 | #107 | Exceptional 57.5% |
| Immigrants | Canada | 98.1 /100 | #108 | Exceptional 57.5% |
| Immigrants | North America | 98.1 /100 | #109 | Exceptional 57.5% |
| Japanese | 98.0 /100 | #110 | Exceptional 57.5% |
| Greeks | 98.0 /100 | #111 | Exceptional 57.5% |
| Pueblo | 98.0 /100 | #112 | Exceptional 57.5% |
| Zimbabweans | 96.9 /100 | #113 | Exceptional 57.2% |
| Immigrants | Lebanon | 96.8 /100 | #114 | Exceptional 57.2% |