Hungarian vs Immigrants from Ghana 2 or more Vehicles in Household
COMPARE
Hungarian
Immigrants from Ghana
2 or more Vehicles in Household
2 or more Vehicles in Household Comparison
Hungarians
Immigrants from Ghana
56.5%
2 OR MORE VEHICLES IN HOUSEHOLD
89.1/ 100
METRIC RATING
132nd/ 347
METRIC RANK
47.4%
2 OR MORE VEHICLES IN HOUSEHOLD
0.0/ 100
METRIC RATING
314th/ 347
METRIC RANK
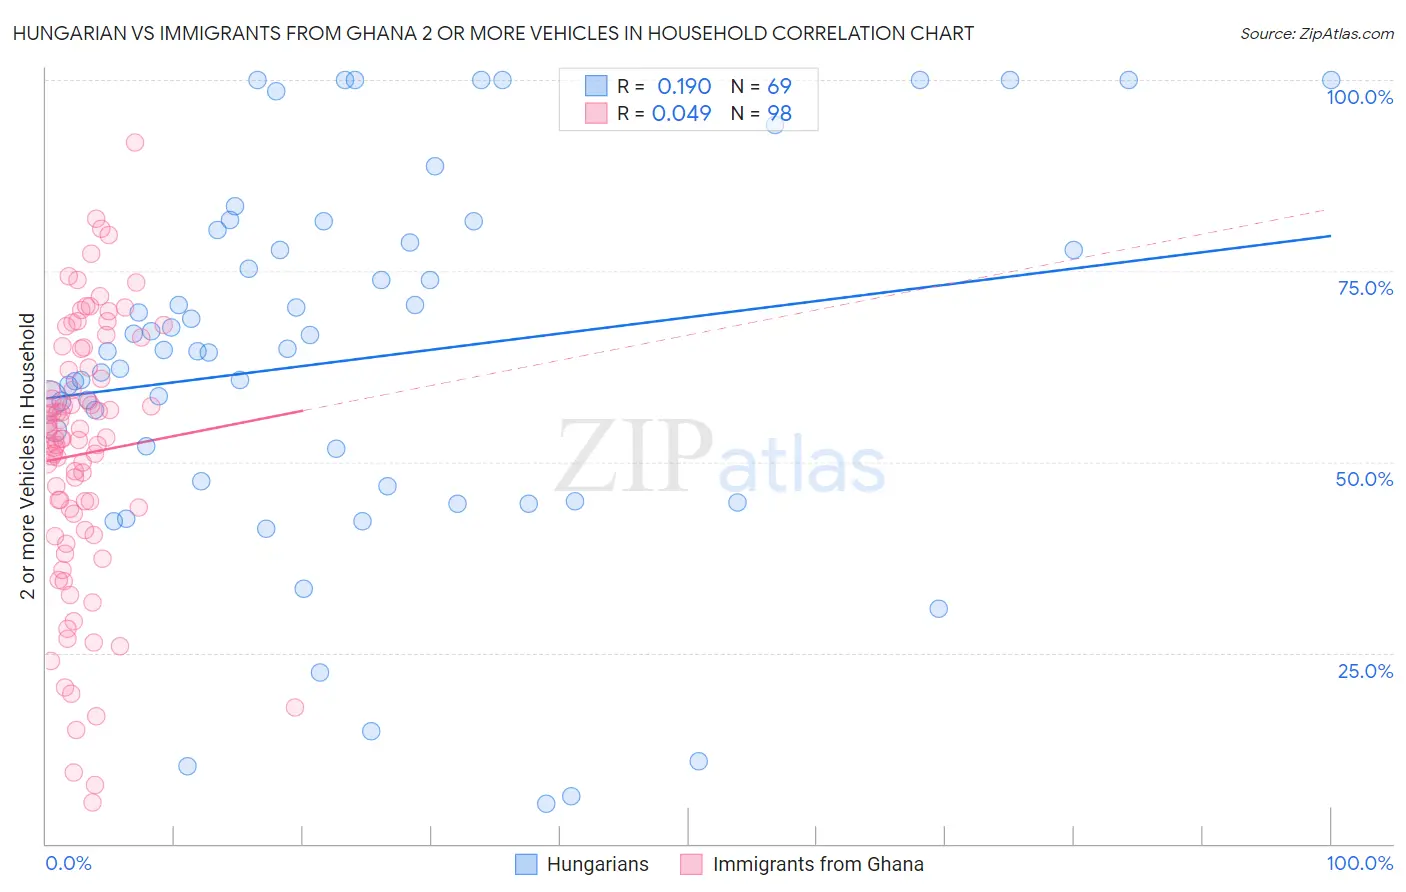
Hungarian vs Immigrants from Ghana 2 or more Vehicles in Household Correlation Chart
The statistical analysis conducted on geographies consisting of 485,946,107 people shows a poor positive correlation between the proportion of Hungarians and percentage of households with 2 or more vehicles available in the United States with a correlation coefficient (R) of 0.190 and weighted average of 56.5%. Similarly, the statistical analysis conducted on geographies consisting of 199,813,535 people shows no correlation between the proportion of Immigrants from Ghana and percentage of households with 2 or more vehicles available in the United States with a correlation coefficient (R) of 0.049 and weighted average of 47.4%, a difference of 19.3%.
2 or more Vehicles in Household Correlation Summary
| Measurement | Hungarian | Immigrants from Ghana |
| Minimum | 5.2% | 5.4% |
| Maximum | 100.0% | 91.9% |
| Range | 94.8% | 86.4% |
| Mean | 63.4% | 51.0% |
| Median | 64.5% | 53.0% |
| Interquartile 25% (IQ1) | 47.2% | 41.0% |
| Interquartile 75% (IQ3) | 79.5% | 62.3% |
| Interquartile Range (IQR) | 32.4% | 21.3% |
| Standard Deviation (Sample) | 24.4% | 17.5% |
| Standard Deviation (Population) | 24.2% | 17.5% |
Similar Demographics by 2 or more Vehicles in Household
Demographics Similar to Hungarians by 2 or more Vehicles in Household
In terms of 2 or more vehicles in household, the demographic groups most similar to Hungarians are Bulgarian (56.5%, a difference of 0.060%), Comanche (56.5%, a difference of 0.070%), Yugoslavian (56.6%, a difference of 0.090%), Ute (56.6%, a difference of 0.13%), and Immigrants from South Central Asia (56.6%, a difference of 0.15%).
| Demographics | Rating | Rank | 2 or more Vehicles in Household |
| Tsimshian | 91.6 /100 | #125 | Exceptional 56.7% |
| Estonians | 90.9 /100 | #126 | Exceptional 56.6% |
| Immigrants | Thailand | 90.7 /100 | #127 | Exceptional 56.6% |
| Immigrants | South Central Asia | 90.5 /100 | #128 | Exceptional 56.6% |
| Ute | 90.4 /100 | #129 | Exceptional 56.6% |
| Yugoslavians | 90.0 /100 | #130 | Exceptional 56.6% |
| Bulgarians | 89.7 /100 | #131 | Excellent 56.5% |
| Hungarians | 89.1 /100 | #132 | Excellent 56.5% |
| Comanche | 88.4 /100 | #133 | Excellent 56.5% |
| Immigrants | Azores | 86.6 /100 | #134 | Excellent 56.4% |
| Blackfeet | 86.5 /100 | #135 | Excellent 56.4% |
| Immigrants | Asia | 86.0 /100 | #136 | Excellent 56.3% |
| Cubans | 84.8 /100 | #137 | Excellent 56.3% |
| Salvadorans | 84.7 /100 | #138 | Excellent 56.3% |
| Armenians | 84.3 /100 | #139 | Excellent 56.3% |
Demographics Similar to Immigrants from Ghana by 2 or more Vehicles in Household
In terms of 2 or more vehicles in household, the demographic groups most similar to Immigrants from Ghana are U.S. Virgin Islander (47.5%, a difference of 0.22%), Haitian (47.6%, a difference of 0.40%), Puerto Rican (47.1%, a difference of 0.57%), Immigrants from Belarus (47.9%, a difference of 1.1%), and Ghanaian (48.0%, a difference of 1.3%).
| Demographics | Rating | Rank | 2 or more Vehicles in Household |
| Hopi | 0.0 /100 | #307 | Tragic 49.0% |
| Albanians | 0.0 /100 | #308 | Tragic 49.0% |
| Moroccans | 0.0 /100 | #309 | Tragic 48.8% |
| Ghanaians | 0.0 /100 | #310 | Tragic 48.0% |
| Immigrants | Belarus | 0.0 /100 | #311 | Tragic 47.9% |
| Haitians | 0.0 /100 | #312 | Tragic 47.6% |
| U.S. Virgin Islanders | 0.0 /100 | #313 | Tragic 47.5% |
| Immigrants | Ghana | 0.0 /100 | #314 | Tragic 47.4% |
| Puerto Ricans | 0.0 /100 | #315 | Tragic 47.1% |
| Cape Verdeans | 0.0 /100 | #316 | Tragic 46.8% |
| Immigrants | Haiti | 0.0 /100 | #317 | Tragic 46.5% |
| Immigrants | Albania | 0.0 /100 | #318 | Tragic 46.0% |
| Jamaicans | 0.0 /100 | #319 | Tragic 45.8% |
| Soviet Union | 0.0 /100 | #320 | Tragic 45.7% |
| Immigrants | Jamaica | 0.0 /100 | #321 | Tragic 44.5% |