Hungarian vs Immigrants from Netherlands Single Mother Households
COMPARE
Hungarian
Immigrants from Netherlands
Single Mother Households
Single Mother Households Comparison
Hungarians
Immigrants from Netherlands
5.7%
SINGLE MOTHER HOUSEHOLDS
97.6/ 100
METRIC RATING
85th/ 347
METRIC RANK
5.6%
SINGLE MOTHER HOUSEHOLDS
98.4/ 100
METRIC RATING
72nd/ 347
METRIC RANK
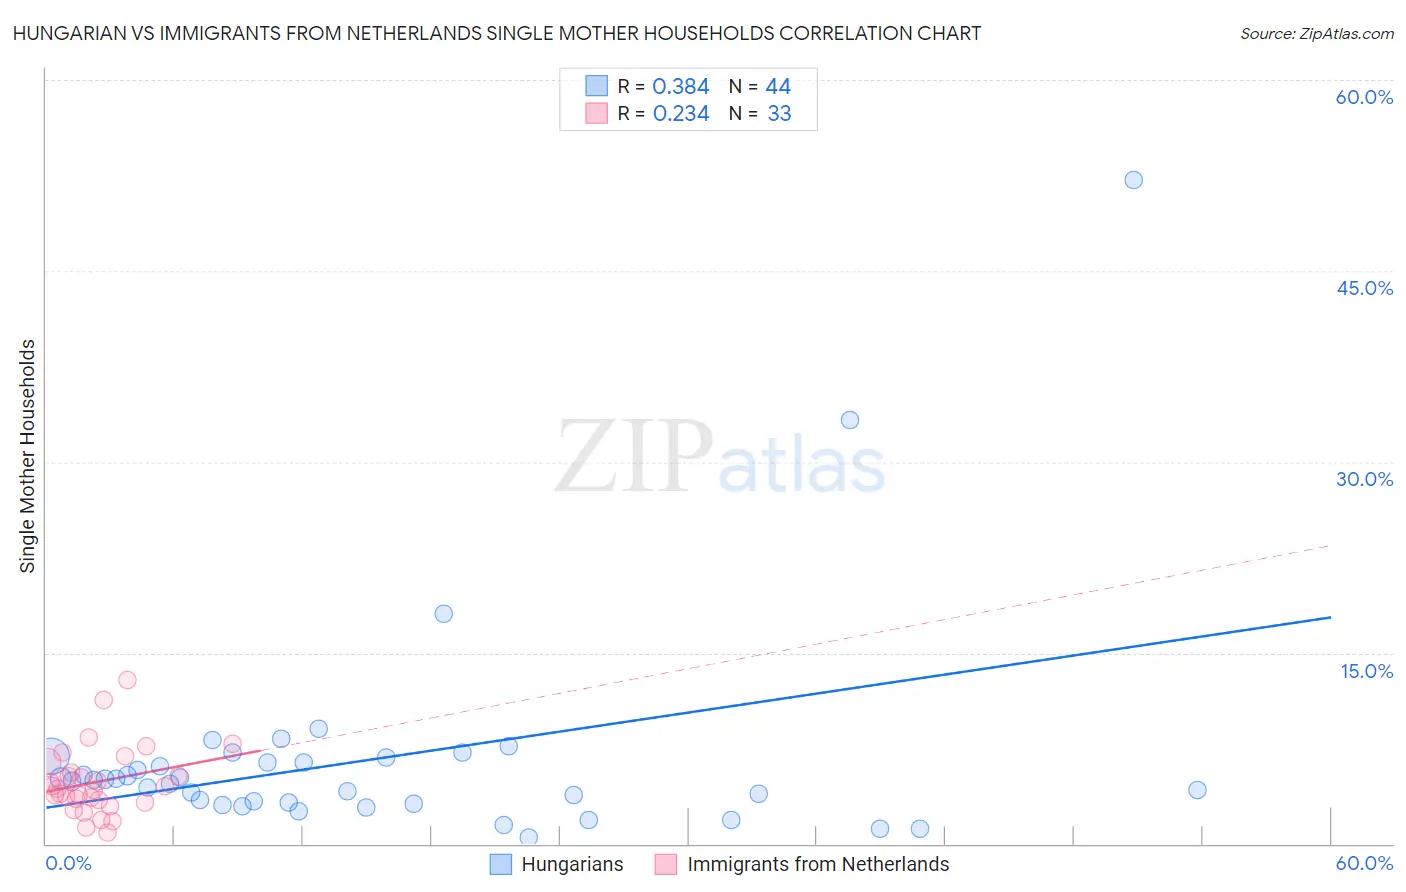
Hungarian vs Immigrants from Netherlands Single Mother Households Correlation Chart
The statistical analysis conducted on geographies consisting of 483,597,168 people shows a mild positive correlation between the proportion of Hungarians and percentage of single mother households in the United States with a correlation coefficient (R) of 0.384 and weighted average of 5.7%. Similarly, the statistical analysis conducted on geographies consisting of 237,246,483 people shows a weak positive correlation between the proportion of Immigrants from Netherlands and percentage of single mother households in the United States with a correlation coefficient (R) of 0.234 and weighted average of 5.6%, a difference of 1.3%.
Single Mother Households Correlation Summary
| Measurement | Hungarian | Immigrants from Netherlands |
| Minimum | 0.48% | 0.89% |
| Maximum | 52.2% | 12.9% |
| Range | 51.7% | 12.0% |
| Mean | 6.6% | 4.9% |
| Median | 4.9% | 4.4% |
| Interquartile 25% (IQ1) | 3.2% | 3.3% |
| Interquartile 75% (IQ3) | 6.6% | 6.0% |
| Interquartile Range (IQR) | 3.4% | 2.7% |
| Standard Deviation (Sample) | 8.7% | 2.6% |
| Standard Deviation (Population) | 8.6% | 2.6% |
Demographics Similar to Hungarians and Immigrants from Netherlands by Single Mother Households
In terms of single mother households, the demographic groups most similar to Hungarians are Finnish (5.7%, a difference of 0.030%), Immigrants from Turkey (5.7%, a difference of 0.11%), Carpatho Rusyn (5.7%, a difference of 0.15%), Israeli (5.7%, a difference of 0.18%), and Immigrants from Hungary (5.7%, a difference of 0.23%). Similarly, the demographic groups most similar to Immigrants from Netherlands are Immigrants from Asia (5.6%, a difference of 0.060%), Immigrants from Kazakhstan (5.6%, a difference of 0.090%), Immigrants from North America (5.6%, a difference of 0.090%), Immigrants from Eastern Europe (5.6%, a difference of 0.10%), and Asian (5.6%, a difference of 0.18%).
| Demographics | Rating | Rank | Single Mother Households |
| Immigrants | Bulgaria | 98.5 /100 | #68 | Exceptional 5.6% |
| Asians | 98.5 /100 | #69 | Exceptional 5.6% |
| Immigrants | Eastern Europe | 98.4 /100 | #70 | Exceptional 5.6% |
| Immigrants | Kazakhstan | 98.4 /100 | #71 | Exceptional 5.6% |
| Immigrants | Netherlands | 98.4 /100 | #72 | Exceptional 5.6% |
| Immigrants | Asia | 98.4 /100 | #73 | Exceptional 5.6% |
| Immigrants | North America | 98.3 /100 | #74 | Exceptional 5.6% |
| Slovenes | 98.3 /100 | #75 | Exceptional 5.6% |
| New Zealanders | 98.2 /100 | #76 | Exceptional 5.6% |
| Romanians | 98.1 /100 | #77 | Exceptional 5.6% |
| Swiss | 98.1 /100 | #78 | Exceptional 5.6% |
| Immigrants | Sri Lanka | 98.0 /100 | #79 | Exceptional 5.6% |
| Czechs | 97.9 /100 | #80 | Exceptional 5.6% |
| Immigrants | Moldova | 97.9 /100 | #81 | Exceptional 5.6% |
| Immigrants | Malaysia | 97.8 /100 | #82 | Exceptional 5.7% |
| Immigrants | Hungary | 97.8 /100 | #83 | Exceptional 5.7% |
| Carpatho Rusyns | 97.7 /100 | #84 | Exceptional 5.7% |
| Hungarians | 97.6 /100 | #85 | Exceptional 5.7% |
| Finns | 97.6 /100 | #86 | Exceptional 5.7% |
| Immigrants | Turkey | 97.5 /100 | #87 | Exceptional 5.7% |
| Israelis | 97.4 /100 | #88 | Exceptional 5.7% |