Asian vs Immigrants from Netherlands 2 or more Vehicles in Household
COMPARE
Asian
Immigrants from Netherlands
2 or more Vehicles in Household
2 or more Vehicles in Household Comparison
Asians
Immigrants from Netherlands
57.0%
2 OR MORE VEHICLES IN HOUSEHOLD
95.1/ 100
METRIC RATING
118th/ 347
METRIC RANK
57.5%
2 OR MORE VEHICLES IN HOUSEHOLD
98.2/ 100
METRIC RATING
107th/ 347
METRIC RANK
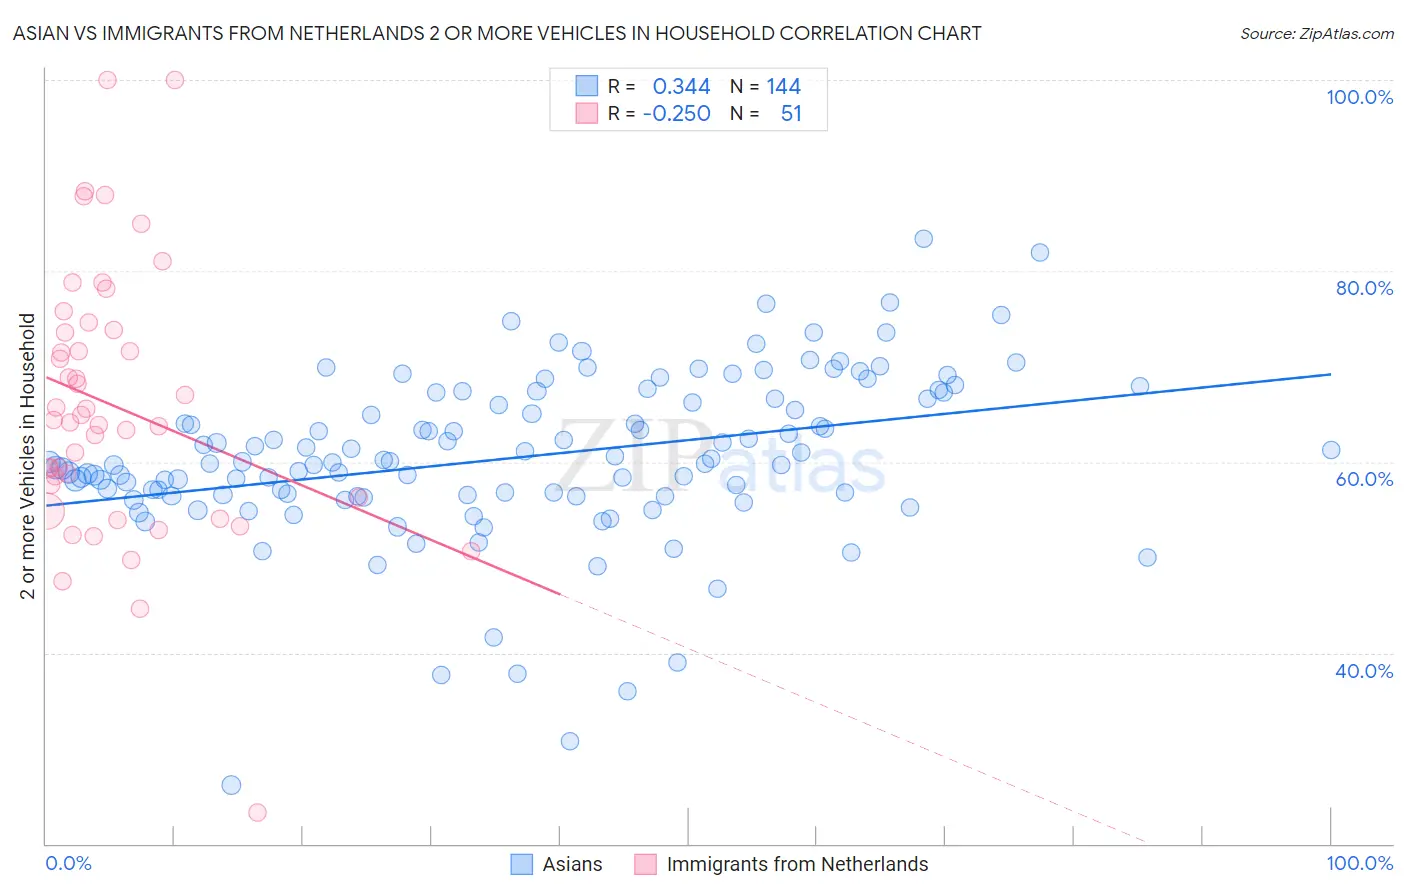
Asian vs Immigrants from Netherlands 2 or more Vehicles in Household Correlation Chart
The statistical analysis conducted on geographies consisting of 550,191,593 people shows a mild positive correlation between the proportion of Asians and percentage of households with 2 or more vehicles available in the United States with a correlation coefficient (R) of 0.344 and weighted average of 57.0%. Similarly, the statistical analysis conducted on geographies consisting of 237,817,219 people shows a weak negative correlation between the proportion of Immigrants from Netherlands and percentage of households with 2 or more vehicles available in the United States with a correlation coefficient (R) of -0.250 and weighted average of 57.5%, a difference of 0.97%.
2 or more Vehicles in Household Correlation Summary
| Measurement | Asian | Immigrants from Netherlands |
| Minimum | 26.1% | 23.3% |
| Maximum | 83.4% | 100.0% |
| Range | 57.2% | 76.7% |
| Mean | 60.5% | 65.9% |
| Median | 59.9% | 64.4% |
| Interquartile 25% (IQ1) | 56.5% | 56.2% |
| Interquartile 75% (IQ3) | 66.6% | 73.9% |
| Interquartile Range (IQR) | 10.1% | 17.6% |
| Standard Deviation (Sample) | 8.8% | 14.1% |
| Standard Deviation (Population) | 8.8% | 14.0% |
Demographics Similar to Asians and Immigrants from Netherlands by 2 or more Vehicles in Household
In terms of 2 or more vehicles in household, the demographic groups most similar to Asians are Native/Alaskan (57.0%, a difference of 0.030%), Costa Rican (56.9%, a difference of 0.070%), Iraqi (57.1%, a difference of 0.16%), Sioux (56.8%, a difference of 0.24%), and Immigrants from Jordan (57.2%, a difference of 0.36%). Similarly, the demographic groups most similar to Immigrants from Netherlands are Immigrants from Canada (57.5%, a difference of 0.010%), Immigrants from Oceania (57.5%, a difference of 0.020%), Immigrants from Korea (57.6%, a difference of 0.030%), Immigrants from Bolivia (57.6%, a difference of 0.040%), and Jordanian (57.6%, a difference of 0.040%).
| Demographics | Rating | Rank | 2 or more Vehicles in Household |
| Immigrants | Bolivia | 98.2 /100 | #102 | Exceptional 57.6% |
| Jordanians | 98.2 /100 | #103 | Exceptional 57.6% |
| Immigrants | Indonesia | 98.2 /100 | #104 | Exceptional 57.6% |
| Immigrants | Korea | 98.2 /100 | #105 | Exceptional 57.6% |
| Immigrants | Oceania | 98.2 /100 | #106 | Exceptional 57.5% |
| Immigrants | Netherlands | 98.2 /100 | #107 | Exceptional 57.5% |
| Immigrants | Canada | 98.1 /100 | #108 | Exceptional 57.5% |
| Immigrants | North America | 98.1 /100 | #109 | Exceptional 57.5% |
| Japanese | 98.0 /100 | #110 | Exceptional 57.5% |
| Greeks | 98.0 /100 | #111 | Exceptional 57.5% |
| Pueblo | 98.0 /100 | #112 | Exceptional 57.5% |
| Zimbabweans | 96.9 /100 | #113 | Exceptional 57.2% |
| Immigrants | Lebanon | 96.8 /100 | #114 | Exceptional 57.2% |
| Chippewa | 96.6 /100 | #115 | Exceptional 57.2% |
| Immigrants | Jordan | 96.6 /100 | #116 | Exceptional 57.2% |
| Iraqis | 95.8 /100 | #117 | Exceptional 57.1% |
| Asians | 95.1 /100 | #118 | Exceptional 57.0% |
| Natives/Alaskans | 95.0 /100 | #119 | Exceptional 57.0% |
| Costa Ricans | 94.7 /100 | #120 | Exceptional 56.9% |
| Sioux | 93.8 /100 | #121 | Exceptional 56.8% |
| Immigrants | South Africa | 92.5 /100 | #122 | Exceptional 56.7% |