Hispanic or Latino vs Immigrants from Netherlands 2 or more Vehicles in Household
COMPARE
Hispanic or Latino
Immigrants from Netherlands
2 or more Vehicles in Household
2 or more Vehicles in Household Comparison
Hispanics or Latinos
Immigrants from Netherlands
57.9%
2 OR MORE VEHICLES IN HOUSEHOLD
99.0/ 100
METRIC RATING
90th/ 347
METRIC RANK
57.5%
2 OR MORE VEHICLES IN HOUSEHOLD
98.2/ 100
METRIC RATING
107th/ 347
METRIC RANK
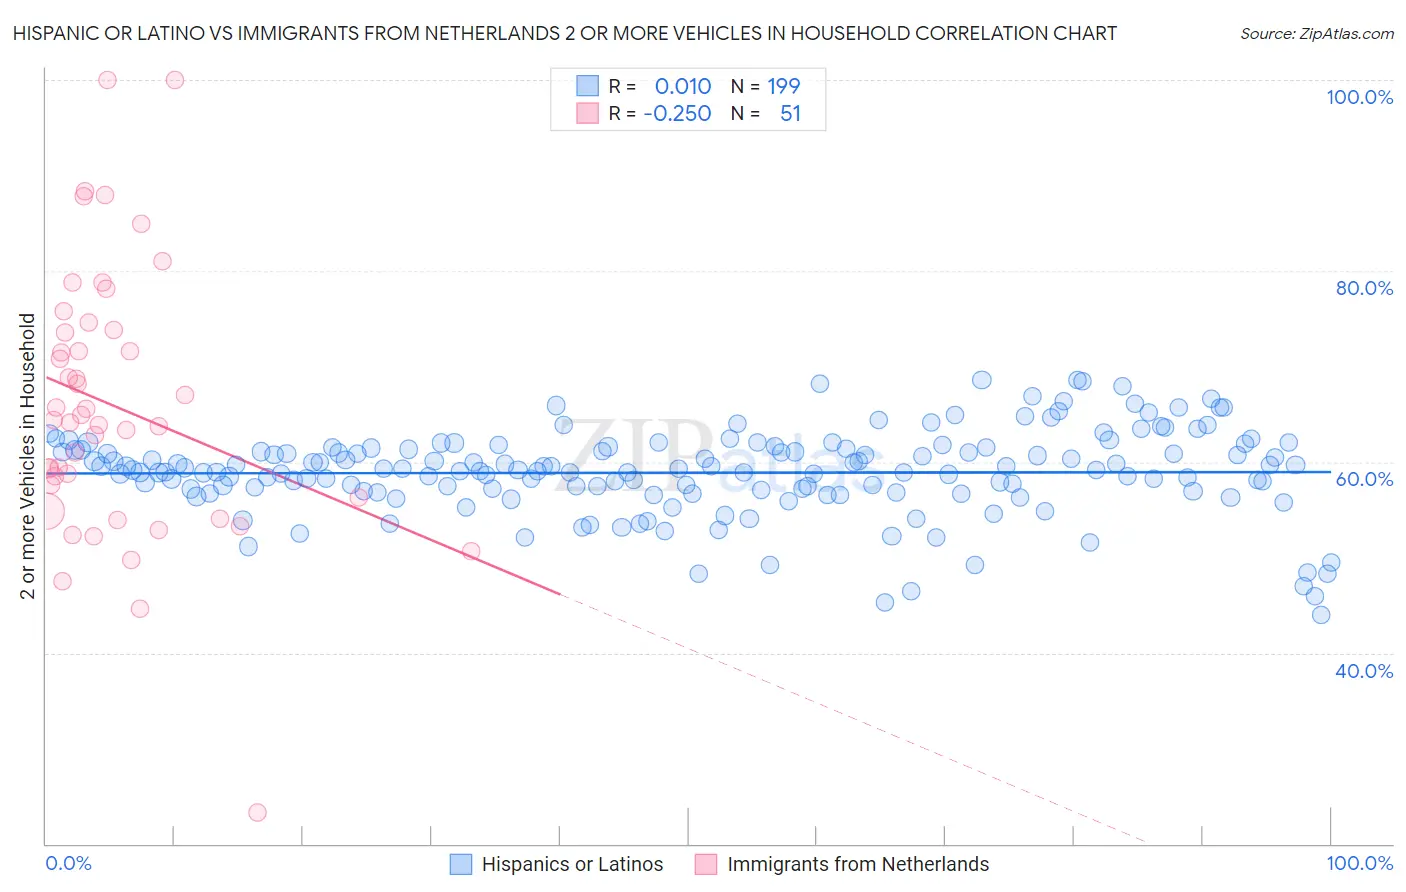
Hispanic or Latino vs Immigrants from Netherlands 2 or more Vehicles in Household Correlation Chart
The statistical analysis conducted on geographies consisting of 560,775,190 people shows no correlation between the proportion of Hispanics or Latinos and percentage of households with 2 or more vehicles available in the United States with a correlation coefficient (R) of 0.010 and weighted average of 57.9%. Similarly, the statistical analysis conducted on geographies consisting of 237,817,219 people shows a weak negative correlation between the proportion of Immigrants from Netherlands and percentage of households with 2 or more vehicles available in the United States with a correlation coefficient (R) of -0.250 and weighted average of 57.5%, a difference of 0.63%.
2 or more Vehicles in Household Correlation Summary
| Measurement | Hispanic or Latino | Immigrants from Netherlands |
| Minimum | 44.0% | 23.3% |
| Maximum | 68.6% | 100.0% |
| Range | 24.6% | 76.7% |
| Mean | 58.9% | 65.9% |
| Median | 59.1% | 64.4% |
| Interquartile 25% (IQ1) | 56.9% | 56.2% |
| Interquartile 75% (IQ3) | 61.4% | 73.9% |
| Interquartile Range (IQR) | 4.5% | 17.6% |
| Standard Deviation (Sample) | 4.5% | 14.1% |
| Standard Deviation (Population) | 4.5% | 14.0% |
Demographics Similar to Hispanics or Latinos and Immigrants from Netherlands by 2 or more Vehicles in Household
In terms of 2 or more vehicles in household, the demographic groups most similar to Hispanics or Latinos are Immigrants from Germany (57.9%, a difference of 0.0%), Pakistani (57.9%, a difference of 0.030%), Shoshone (57.9%, a difference of 0.050%), Ottawa (57.9%, a difference of 0.060%), and Immigrants from Iran (57.9%, a difference of 0.070%). Similarly, the demographic groups most similar to Immigrants from Netherlands are Immigrants from Canada (57.5%, a difference of 0.010%), Immigrants from Oceania (57.5%, a difference of 0.020%), Immigrants from Korea (57.6%, a difference of 0.030%), Immigrants from Bolivia (57.6%, a difference of 0.040%), and Jordanian (57.6%, a difference of 0.040%).
| Demographics | Rating | Rank | 2 or more Vehicles in Household |
| Immigrants | Iran | 99.1 /100 | #88 | Exceptional 57.9% |
| Immigrants | Germany | 99.0 /100 | #89 | Exceptional 57.9% |
| Hispanics or Latinos | 99.0 /100 | #90 | Exceptional 57.9% |
| Pakistanis | 99.0 /100 | #91 | Exceptional 57.9% |
| Shoshone | 99.0 /100 | #92 | Exceptional 57.9% |
| Ottawa | 99.0 /100 | #93 | Exceptional 57.9% |
| Filipinos | 98.9 /100 | #94 | Exceptional 57.8% |
| Hmong | 98.9 /100 | #95 | Exceptional 57.8% |
| Burmese | 98.8 /100 | #96 | Exceptional 57.8% |
| Slavs | 98.8 /100 | #97 | Exceptional 57.8% |
| Palestinians | 98.6 /100 | #98 | Exceptional 57.7% |
| Cajuns | 98.5 /100 | #99 | Exceptional 57.7% |
| Fijians | 98.4 /100 | #100 | Exceptional 57.6% |
| Lebanese | 98.3 /100 | #101 | Exceptional 57.6% |
| Immigrants | Bolivia | 98.2 /100 | #102 | Exceptional 57.6% |
| Jordanians | 98.2 /100 | #103 | Exceptional 57.6% |
| Immigrants | Indonesia | 98.2 /100 | #104 | Exceptional 57.6% |
| Immigrants | Korea | 98.2 /100 | #105 | Exceptional 57.6% |
| Immigrants | Oceania | 98.2 /100 | #106 | Exceptional 57.5% |
| Immigrants | Netherlands | 98.2 /100 | #107 | Exceptional 57.5% |
| Immigrants | Canada | 98.1 /100 | #108 | Exceptional 57.5% |