Hungarian vs Immigrants from Bulgaria 2 or more Vehicles in Household
COMPARE
Hungarian
Immigrants from Bulgaria
2 or more Vehicles in Household
2 or more Vehicles in Household Comparison
Hungarians
Immigrants from Bulgaria
56.5%
2 OR MORE VEHICLES IN HOUSEHOLD
89.1/ 100
METRIC RATING
132nd/ 347
METRIC RANK
54.3%
2 OR MORE VEHICLES IN HOUSEHOLD
12.0/ 100
METRIC RATING
209th/ 347
METRIC RANK
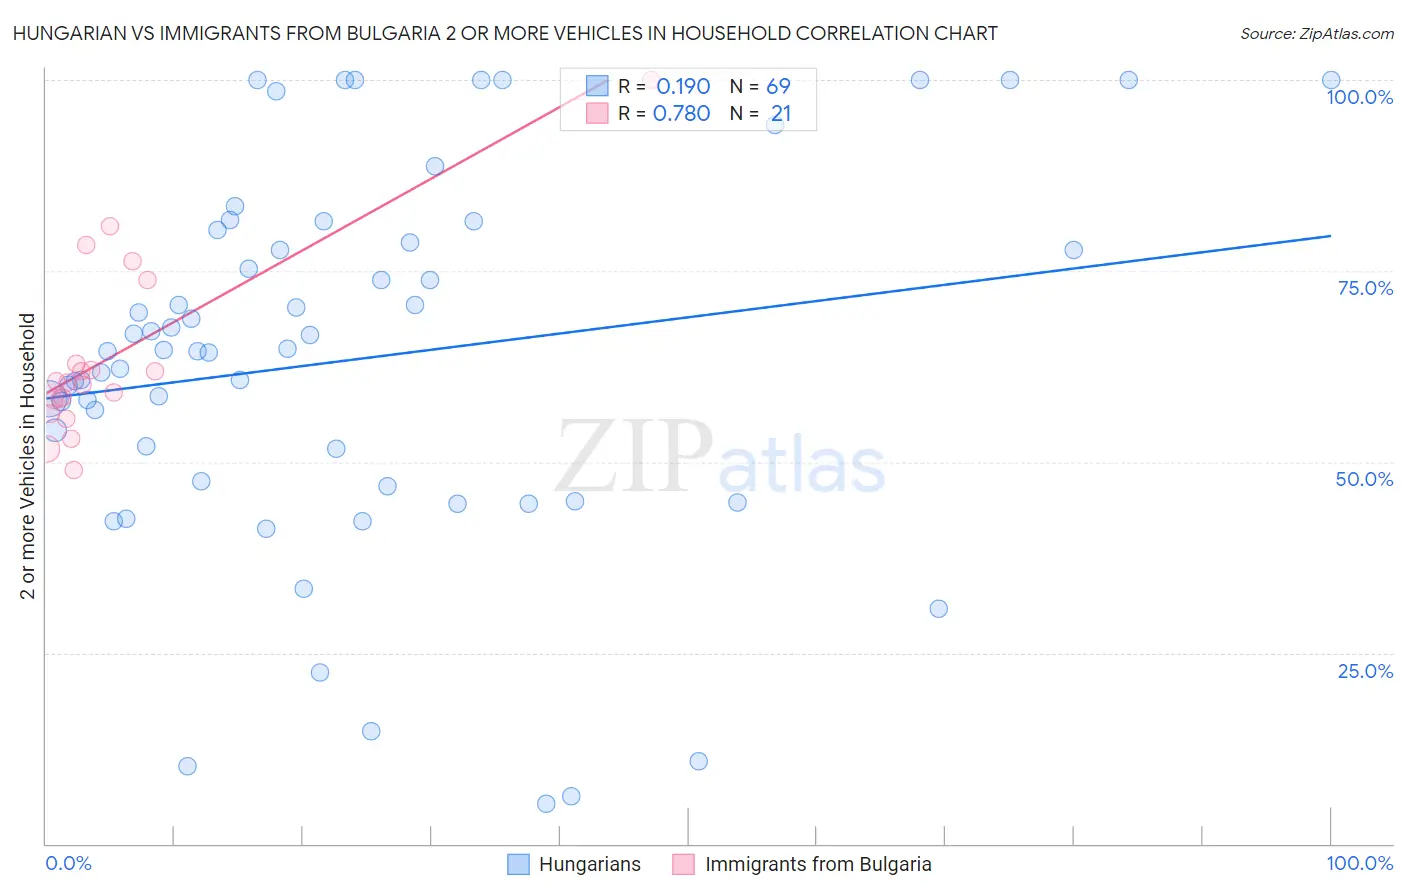
Hungarian vs Immigrants from Bulgaria 2 or more Vehicles in Household Correlation Chart
The statistical analysis conducted on geographies consisting of 485,946,107 people shows a poor positive correlation between the proportion of Hungarians and percentage of households with 2 or more vehicles available in the United States with a correlation coefficient (R) of 0.190 and weighted average of 56.5%. Similarly, the statistical analysis conducted on geographies consisting of 172,541,029 people shows a strong positive correlation between the proportion of Immigrants from Bulgaria and percentage of households with 2 or more vehicles available in the United States with a correlation coefficient (R) of 0.780 and weighted average of 54.3%, a difference of 4.2%.
2 or more Vehicles in Household Correlation Summary
| Measurement | Hungarian | Immigrants from Bulgaria |
| Minimum | 5.2% | 49.0% |
| Maximum | 100.0% | 100.0% |
| Range | 94.8% | 51.0% |
| Mean | 63.4% | 63.7% |
| Median | 64.5% | 60.5% |
| Interquartile 25% (IQ1) | 47.2% | 57.2% |
| Interquartile 75% (IQ3) | 79.5% | 68.3% |
| Interquartile Range (IQR) | 32.4% | 11.1% |
| Standard Deviation (Sample) | 24.4% | 11.9% |
| Standard Deviation (Population) | 24.2% | 11.6% |
Similar Demographics by 2 or more Vehicles in Household
Demographics Similar to Hungarians by 2 or more Vehicles in Household
In terms of 2 or more vehicles in household, the demographic groups most similar to Hungarians are Bulgarian (56.5%, a difference of 0.060%), Comanche (56.5%, a difference of 0.070%), Yugoslavian (56.6%, a difference of 0.090%), Ute (56.6%, a difference of 0.13%), and Immigrants from South Central Asia (56.6%, a difference of 0.15%).
| Demographics | Rating | Rank | 2 or more Vehicles in Household |
| Tsimshian | 91.6 /100 | #125 | Exceptional 56.7% |
| Estonians | 90.9 /100 | #126 | Exceptional 56.6% |
| Immigrants | Thailand | 90.7 /100 | #127 | Exceptional 56.6% |
| Immigrants | South Central Asia | 90.5 /100 | #128 | Exceptional 56.6% |
| Ute | 90.4 /100 | #129 | Exceptional 56.6% |
| Yugoslavians | 90.0 /100 | #130 | Exceptional 56.6% |
| Bulgarians | 89.7 /100 | #131 | Excellent 56.5% |
| Hungarians | 89.1 /100 | #132 | Excellent 56.5% |
| Comanche | 88.4 /100 | #133 | Excellent 56.5% |
| Immigrants | Azores | 86.6 /100 | #134 | Excellent 56.4% |
| Blackfeet | 86.5 /100 | #135 | Excellent 56.4% |
| Immigrants | Asia | 86.0 /100 | #136 | Excellent 56.3% |
| Cubans | 84.8 /100 | #137 | Excellent 56.3% |
| Salvadorans | 84.7 /100 | #138 | Excellent 56.3% |
| Armenians | 84.3 /100 | #139 | Excellent 56.3% |
Demographics Similar to Immigrants from Bulgaria by 2 or more Vehicles in Household
In terms of 2 or more vehicles in household, the demographic groups most similar to Immigrants from Bulgaria are Egyptian (54.3%, a difference of 0.0%), Immigrants from Saudi Arabia (54.2%, a difference of 0.060%), Immigrants from Hungary (54.2%, a difference of 0.070%), Turkish (54.3%, a difference of 0.090%), and Immigrants from Chile (54.2%, a difference of 0.090%).
| Demographics | Rating | Rank | 2 or more Vehicles in Household |
| Immigrants | North Macedonia | 14.9 /100 | #202 | Poor 54.4% |
| Immigrants | Peru | 14.3 /100 | #203 | Poor 54.4% |
| Immigrants | Belgium | 13.7 /100 | #204 | Poor 54.3% |
| Cheyenne | 13.6 /100 | #205 | Poor 54.3% |
| Immigrants | Latin America | 13.1 /100 | #206 | Poor 54.3% |
| Turks | 13.0 /100 | #207 | Poor 54.3% |
| Egyptians | 12.0 /100 | #208 | Poor 54.3% |
| Immigrants | Bulgaria | 12.0 /100 | #209 | Poor 54.3% |
| Immigrants | Saudi Arabia | 11.3 /100 | #210 | Poor 54.2% |
| Immigrants | Hungary | 11.3 /100 | #211 | Poor 54.2% |
| Immigrants | Chile | 11.1 /100 | #212 | Poor 54.2% |
| Guatemalans | 9.6 /100 | #213 | Tragic 54.1% |
| Immigrants | Czechoslovakia | 9.4 /100 | #214 | Tragic 54.1% |
| Aleuts | 9.3 /100 | #215 | Tragic 54.1% |
| Immigrants | Western Asia | 9.3 /100 | #216 | Tragic 54.1% |