Hungarian vs Bahamian 2 or more Vehicles in Household
COMPARE
Hungarian
Bahamian
2 or more Vehicles in Household
2 or more Vehicles in Household Comparison
Hungarians
Bahamians
56.5%
2 OR MORE VEHICLES IN HOUSEHOLD
89.1/ 100
METRIC RATING
132nd/ 347
METRIC RANK
51.5%
2 OR MORE VEHICLES IN HOUSEHOLD
0.1/ 100
METRIC RATING
282nd/ 347
METRIC RANK
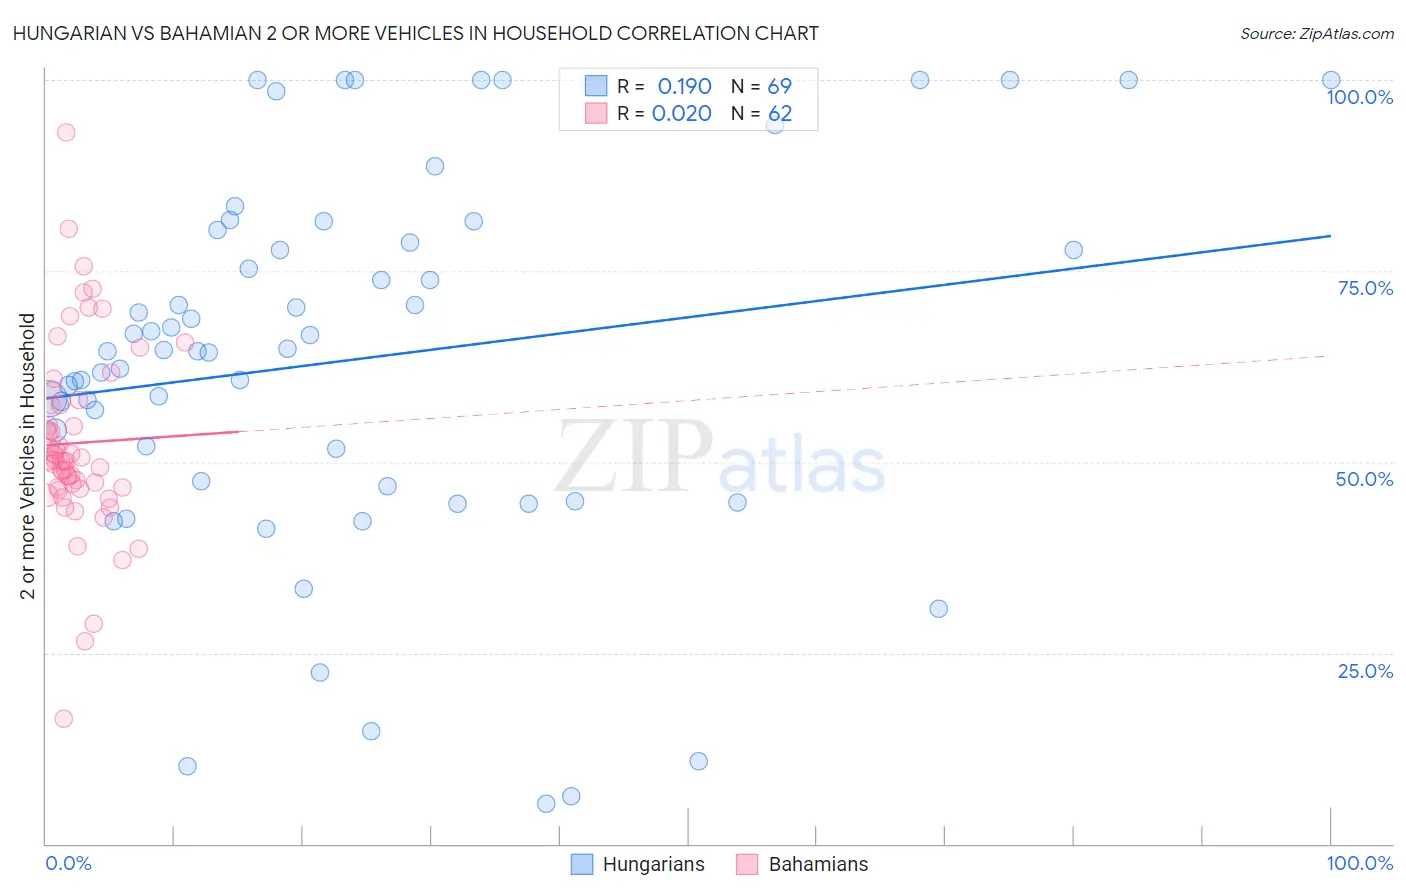
Hungarian vs Bahamian 2 or more Vehicles in Household Correlation Chart
The statistical analysis conducted on geographies consisting of 485,946,107 people shows a poor positive correlation between the proportion of Hungarians and percentage of households with 2 or more vehicles available in the United States with a correlation coefficient (R) of 0.190 and weighted average of 56.5%. Similarly, the statistical analysis conducted on geographies consisting of 112,649,221 people shows no correlation between the proportion of Bahamians and percentage of households with 2 or more vehicles available in the United States with a correlation coefficient (R) of 0.020 and weighted average of 51.5%, a difference of 9.7%.
2 or more Vehicles in Household Correlation Summary
| Measurement | Hungarian | Bahamian |
| Minimum | 5.2% | 16.4% |
| Maximum | 100.0% | 93.2% |
| Range | 94.8% | 76.8% |
| Mean | 63.4% | 52.5% |
| Median | 64.5% | 50.1% |
| Interquartile 25% (IQ1) | 47.2% | 46.7% |
| Interquartile 75% (IQ3) | 79.5% | 57.5% |
| Interquartile Range (IQR) | 32.4% | 10.8% |
| Standard Deviation (Sample) | 24.4% | 12.5% |
| Standard Deviation (Population) | 24.2% | 12.4% |
Similar Demographics by 2 or more Vehicles in Household
Demographics Similar to Hungarians by 2 or more Vehicles in Household
In terms of 2 or more vehicles in household, the demographic groups most similar to Hungarians are Bulgarian (56.5%, a difference of 0.060%), Comanche (56.5%, a difference of 0.070%), Yugoslavian (56.6%, a difference of 0.090%), Ute (56.6%, a difference of 0.13%), and Immigrants from South Central Asia (56.6%, a difference of 0.15%).
| Demographics | Rating | Rank | 2 or more Vehicles in Household |
| Tsimshian | 91.6 /100 | #125 | Exceptional 56.7% |
| Estonians | 90.9 /100 | #126 | Exceptional 56.6% |
| Immigrants | Thailand | 90.7 /100 | #127 | Exceptional 56.6% |
| Immigrants | South Central Asia | 90.5 /100 | #128 | Exceptional 56.6% |
| Ute | 90.4 /100 | #129 | Exceptional 56.6% |
| Yugoslavians | 90.0 /100 | #130 | Exceptional 56.6% |
| Bulgarians | 89.7 /100 | #131 | Excellent 56.5% |
| Hungarians | 89.1 /100 | #132 | Excellent 56.5% |
| Comanche | 88.4 /100 | #133 | Excellent 56.5% |
| Immigrants | Azores | 86.6 /100 | #134 | Excellent 56.4% |
| Blackfeet | 86.5 /100 | #135 | Excellent 56.4% |
| Immigrants | Asia | 86.0 /100 | #136 | Excellent 56.3% |
| Cubans | 84.8 /100 | #137 | Excellent 56.3% |
| Salvadorans | 84.7 /100 | #138 | Excellent 56.3% |
| Armenians | 84.3 /100 | #139 | Excellent 56.3% |
Demographics Similar to Bahamians by 2 or more Vehicles in Household
In terms of 2 or more vehicles in household, the demographic groups most similar to Bahamians are Immigrants from Kazakhstan (51.6%, a difference of 0.060%), Immigrants from China (51.5%, a difference of 0.080%), Immigrants from Zaire (51.5%, a difference of 0.12%), Immigrants from Uruguay (51.4%, a difference of 0.28%), and Immigrants from Eastern Europe (51.7%, a difference of 0.37%).
| Demographics | Rating | Rank | 2 or more Vehicles in Household |
| Immigrants | Honduras | 0.2 /100 | #275 | Tragic 51.8% |
| Immigrants | Croatia | 0.2 /100 | #276 | Tragic 51.8% |
| Immigrants | Africa | 0.2 /100 | #277 | Tragic 51.8% |
| Yuman | 0.1 /100 | #278 | Tragic 51.7% |
| Liberians | 0.1 /100 | #279 | Tragic 51.7% |
| Immigrants | Eastern Europe | 0.1 /100 | #280 | Tragic 51.7% |
| Immigrants | Kazakhstan | 0.1 /100 | #281 | Tragic 51.6% |
| Bahamians | 0.1 /100 | #282 | Tragic 51.5% |
| Immigrants | China | 0.1 /100 | #283 | Tragic 51.5% |
| Immigrants | Zaire | 0.1 /100 | #284 | Tragic 51.5% |
| Immigrants | Uruguay | 0.1 /100 | #285 | Tragic 51.4% |
| Immigrants | Liberia | 0.1 /100 | #286 | Tragic 51.3% |
| Immigrants | Serbia | 0.1 /100 | #287 | Tragic 51.3% |
| Okinawans | 0.1 /100 | #288 | Tragic 51.2% |
| Somalis | 0.0 /100 | #289 | Tragic 51.1% |