Hispanic or Latino vs Immigrants from Venezuela 2 or more Vehicles in Household
COMPARE
Hispanic or Latino
Immigrants from Venezuela
2 or more Vehicles in Household
2 or more Vehicles in Household Comparison
Hispanics or Latinos
Immigrants from Venezuela
57.9%
2 OR MORE VEHICLES IN HOUSEHOLD
99.0/ 100
METRIC RATING
90th/ 347
METRIC RANK
55.8%
2 OR MORE VEHICLES IN HOUSEHOLD
70.7/ 100
METRIC RATING
155th/ 347
METRIC RANK
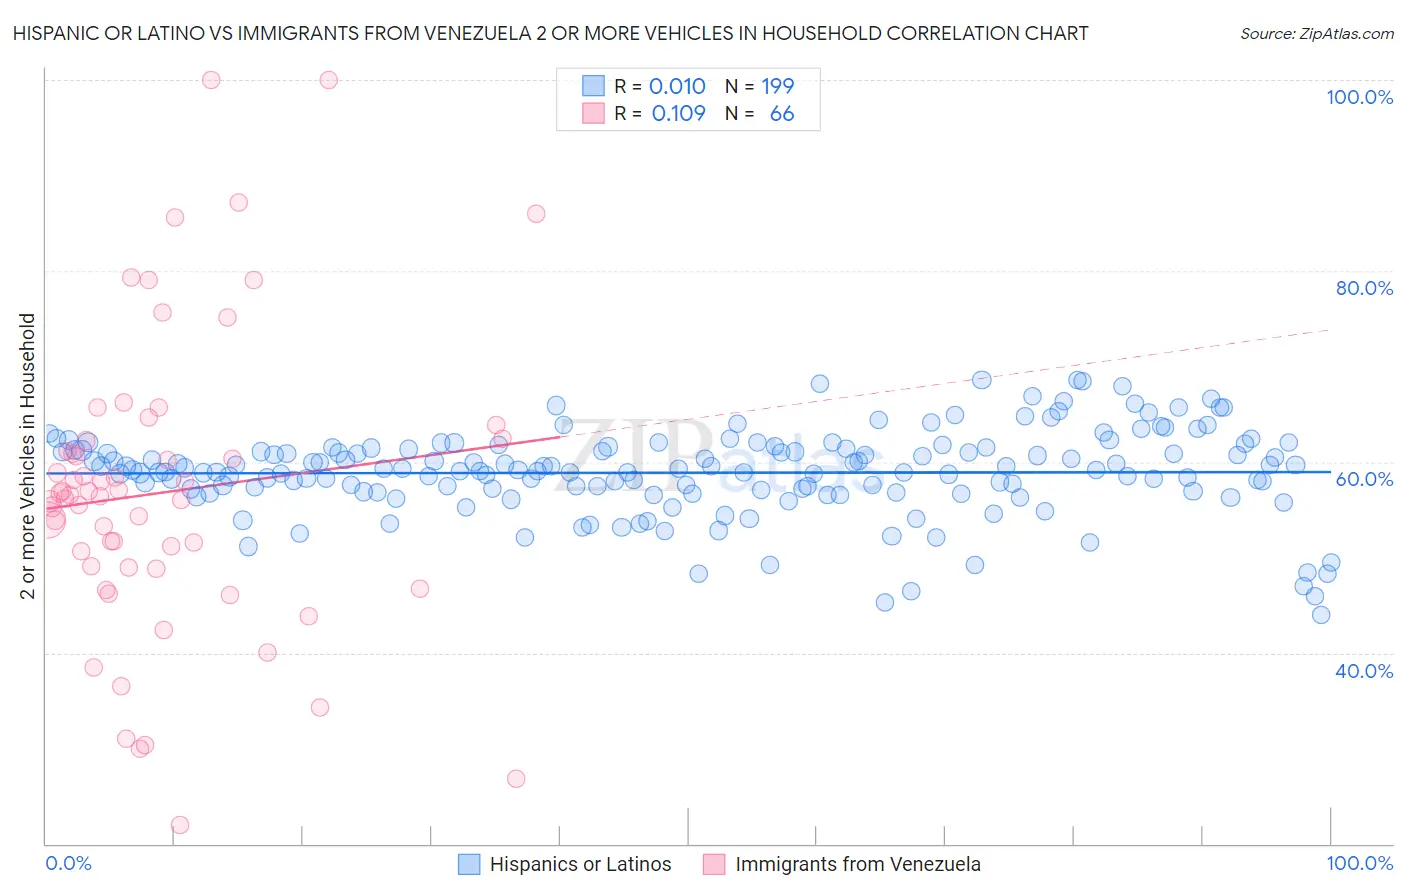
Hispanic or Latino vs Immigrants from Venezuela 2 or more Vehicles in Household Correlation Chart
The statistical analysis conducted on geographies consisting of 560,775,190 people shows no correlation between the proportion of Hispanics or Latinos and percentage of households with 2 or more vehicles available in the United States with a correlation coefficient (R) of 0.010 and weighted average of 57.9%. Similarly, the statistical analysis conducted on geographies consisting of 287,795,975 people shows a poor positive correlation between the proportion of Immigrants from Venezuela and percentage of households with 2 or more vehicles available in the United States with a correlation coefficient (R) of 0.109 and weighted average of 55.8%, a difference of 3.7%.
2 or more Vehicles in Household Correlation Summary
| Measurement | Hispanic or Latino | Immigrants from Venezuela |
| Minimum | 44.0% | 22.0% |
| Maximum | 68.6% | 100.0% |
| Range | 24.6% | 78.0% |
| Mean | 58.9% | 56.8% |
| Median | 59.1% | 56.4% |
| Interquartile 25% (IQ1) | 56.9% | 49.0% |
| Interquartile 75% (IQ3) | 61.4% | 62.2% |
| Interquartile Range (IQR) | 4.5% | 13.3% |
| Standard Deviation (Sample) | 4.5% | 15.7% |
| Standard Deviation (Population) | 4.5% | 15.5% |
Similar Demographics by 2 or more Vehicles in Household
Demographics Similar to Hispanics or Latinos by 2 or more Vehicles in Household
In terms of 2 or more vehicles in household, the demographic groups most similar to Hispanics or Latinos are Immigrants from Germany (57.9%, a difference of 0.0%), Pakistani (57.9%, a difference of 0.030%), Shoshone (57.9%, a difference of 0.050%), Ottawa (57.9%, a difference of 0.060%), and Immigrants from Iran (57.9%, a difference of 0.070%).
| Demographics | Rating | Rank | 2 or more Vehicles in Household |
| Icelanders | 99.2 /100 | #83 | Exceptional 58.0% |
| Maltese | 99.2 /100 | #84 | Exceptional 58.0% |
| Slovaks | 99.2 /100 | #85 | Exceptional 58.0% |
| Potawatomi | 99.1 /100 | #86 | Exceptional 58.0% |
| Thais | 99.1 /100 | #87 | Exceptional 57.9% |
| Immigrants | Iran | 99.1 /100 | #88 | Exceptional 57.9% |
| Immigrants | Germany | 99.0 /100 | #89 | Exceptional 57.9% |
| Hispanics or Latinos | 99.0 /100 | #90 | Exceptional 57.9% |
| Pakistanis | 99.0 /100 | #91 | Exceptional 57.9% |
| Shoshone | 99.0 /100 | #92 | Exceptional 57.9% |
| Ottawa | 99.0 /100 | #93 | Exceptional 57.9% |
| Filipinos | 98.9 /100 | #94 | Exceptional 57.8% |
| Hmong | 98.9 /100 | #95 | Exceptional 57.8% |
| Burmese | 98.8 /100 | #96 | Exceptional 57.8% |
| Slavs | 98.8 /100 | #97 | Exceptional 57.8% |
Demographics Similar to Immigrants from Venezuela by 2 or more Vehicles in Household
In terms of 2 or more vehicles in household, the demographic groups most similar to Immigrants from Venezuela are Ukrainian (55.8%, a difference of 0.0%), Immigrants from Lithuania (55.8%, a difference of 0.010%), Immigrants from Kuwait (55.8%, a difference of 0.030%), Lumbee (55.9%, a difference of 0.060%), and Tlingit-Haida (55.8%, a difference of 0.10%).
| Demographics | Rating | Rank | 2 or more Vehicles in Household |
| Immigrants | Moldova | 80.2 /100 | #148 | Excellent 56.1% |
| Chileans | 80.2 /100 | #149 | Excellent 56.1% |
| Nicaraguans | 79.9 /100 | #150 | Good 56.1% |
| Immigrants | Northern Europe | 78.7 /100 | #151 | Good 56.1% |
| Immigrants | Pakistan | 78.1 /100 | #152 | Good 56.1% |
| Lumbee | 71.9 /100 | #153 | Good 55.9% |
| Ukrainians | 70.8 /100 | #154 | Good 55.8% |
| Immigrants | Venezuela | 70.7 /100 | #155 | Good 55.8% |
| Immigrants | Lithuania | 70.4 /100 | #156 | Good 55.8% |
| Immigrants | Kuwait | 70.2 /100 | #157 | Good 55.8% |
| Tlingit-Haida | 68.5 /100 | #158 | Good 55.8% |
| Paiute | 68.0 /100 | #159 | Good 55.8% |
| Crow | 67.0 /100 | #160 | Good 55.7% |
| Colville | 61.1 /100 | #161 | Good 55.6% |
| German Russians | 60.9 /100 | #162 | Good 55.6% |