Hispanic or Latino vs Vietnamese 2 or more Vehicles in Household
COMPARE
Hispanic or Latino
Vietnamese
2 or more Vehicles in Household
2 or more Vehicles in Household Comparison
Hispanics or Latinos
Vietnamese
57.9%
2 OR MORE VEHICLES IN HOUSEHOLD
99.0/ 100
METRIC RATING
90th/ 347
METRIC RANK
38.5%
2 OR MORE VEHICLES IN HOUSEHOLD
0.0/ 100
METRIC RATING
336th/ 347
METRIC RANK
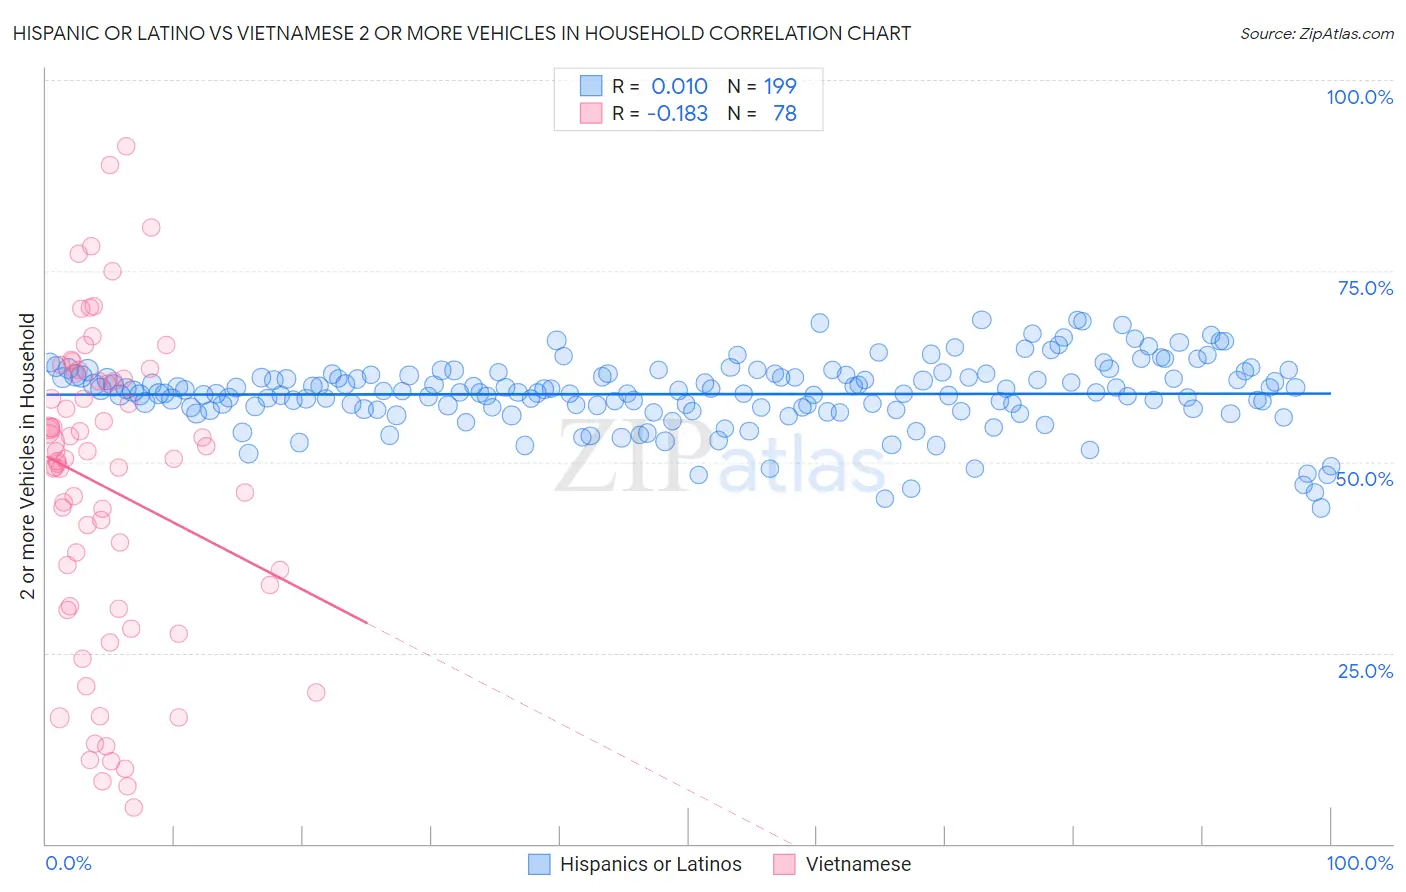
Hispanic or Latino vs Vietnamese 2 or more Vehicles in Household Correlation Chart
The statistical analysis conducted on geographies consisting of 560,775,190 people shows no correlation between the proportion of Hispanics or Latinos and percentage of households with 2 or more vehicles available in the United States with a correlation coefficient (R) of 0.010 and weighted average of 57.9%. Similarly, the statistical analysis conducted on geographies consisting of 170,680,365 people shows a poor negative correlation between the proportion of Vietnamese and percentage of households with 2 or more vehicles available in the United States with a correlation coefficient (R) of -0.183 and weighted average of 38.5%, a difference of 50.4%.
2 or more Vehicles in Household Correlation Summary
| Measurement | Hispanic or Latino | Vietnamese |
| Minimum | 44.0% | 4.7% |
| Maximum | 68.6% | 91.3% |
| Range | 24.6% | 86.6% |
| Mean | 58.9% | 46.7% |
| Median | 59.1% | 50.4% |
| Interquartile 25% (IQ1) | 56.9% | 31.1% |
| Interquartile 75% (IQ3) | 61.4% | 60.6% |
| Interquartile Range (IQR) | 4.5% | 29.5% |
| Standard Deviation (Sample) | 4.5% | 20.3% |
| Standard Deviation (Population) | 4.5% | 20.2% |
Similar Demographics by 2 or more Vehicles in Household
Demographics Similar to Hispanics or Latinos by 2 or more Vehicles in Household
In terms of 2 or more vehicles in household, the demographic groups most similar to Hispanics or Latinos are Immigrants from Germany (57.9%, a difference of 0.0%), Pakistani (57.9%, a difference of 0.030%), Shoshone (57.9%, a difference of 0.050%), Ottawa (57.9%, a difference of 0.060%), and Immigrants from Iran (57.9%, a difference of 0.070%).
| Demographics | Rating | Rank | 2 or more Vehicles in Household |
| Icelanders | 99.2 /100 | #83 | Exceptional 58.0% |
| Maltese | 99.2 /100 | #84 | Exceptional 58.0% |
| Slovaks | 99.2 /100 | #85 | Exceptional 58.0% |
| Potawatomi | 99.1 /100 | #86 | Exceptional 58.0% |
| Thais | 99.1 /100 | #87 | Exceptional 57.9% |
| Immigrants | Iran | 99.1 /100 | #88 | Exceptional 57.9% |
| Immigrants | Germany | 99.0 /100 | #89 | Exceptional 57.9% |
| Hispanics or Latinos | 99.0 /100 | #90 | Exceptional 57.9% |
| Pakistanis | 99.0 /100 | #91 | Exceptional 57.9% |
| Shoshone | 99.0 /100 | #92 | Exceptional 57.9% |
| Ottawa | 99.0 /100 | #93 | Exceptional 57.9% |
| Filipinos | 98.9 /100 | #94 | Exceptional 57.8% |
| Hmong | 98.9 /100 | #95 | Exceptional 57.8% |
| Burmese | 98.8 /100 | #96 | Exceptional 57.8% |
| Slavs | 98.8 /100 | #97 | Exceptional 57.8% |
Demographics Similar to Vietnamese by 2 or more Vehicles in Household
In terms of 2 or more vehicles in household, the demographic groups most similar to Vietnamese are Barbadian (38.3%, a difference of 0.41%), Immigrants from Bangladesh (38.8%, a difference of 0.72%), Immigrants from Uzbekistan (37.9%, a difference of 1.6%), Immigrants from Trinidad and Tobago (40.3%, a difference of 4.6%), and Immigrants from Ecuador (40.5%, a difference of 5.2%).
| Demographics | Rating | Rank | 2 or more Vehicles in Household |
| Ecuadorians | 0.0 /100 | #329 | Tragic 42.0% |
| Immigrants | Dominica | 0.0 /100 | #330 | Tragic 41.6% |
| West Indians | 0.0 /100 | #331 | Tragic 41.3% |
| Trinidadians and Tobagonians | 0.0 /100 | #332 | Tragic 40.9% |
| Immigrants | Ecuador | 0.0 /100 | #333 | Tragic 40.5% |
| Immigrants | Trinidad and Tobago | 0.0 /100 | #334 | Tragic 40.3% |
| Immigrants | Bangladesh | 0.0 /100 | #335 | Tragic 38.8% |
| Vietnamese | 0.0 /100 | #336 | Tragic 38.5% |
| Barbadians | 0.0 /100 | #337 | Tragic 38.3% |
| Immigrants | Uzbekistan | 0.0 /100 | #338 | Tragic 37.9% |
| Immigrants | Barbados | 0.0 /100 | #339 | Tragic 35.8% |
| British West Indians | 0.0 /100 | #340 | Tragic 35.4% |
| Guyanese | 0.0 /100 | #341 | Tragic 35.4% |
| Dominicans | 0.0 /100 | #342 | Tragic 35.3% |
| Immigrants | Guyana | 0.0 /100 | #343 | Tragic 35.0% |