Cherokee vs Immigrants from Venezuela 2 or more Vehicles in Household
COMPARE
Cherokee
Immigrants from Venezuela
2 or more Vehicles in Household
2 or more Vehicles in Household Comparison
Cherokee
Immigrants from Venezuela
59.9%
2 OR MORE VEHICLES IN HOUSEHOLD
100.0/ 100
METRIC RATING
40th/ 347
METRIC RANK
55.8%
2 OR MORE VEHICLES IN HOUSEHOLD
70.7/ 100
METRIC RATING
155th/ 347
METRIC RANK
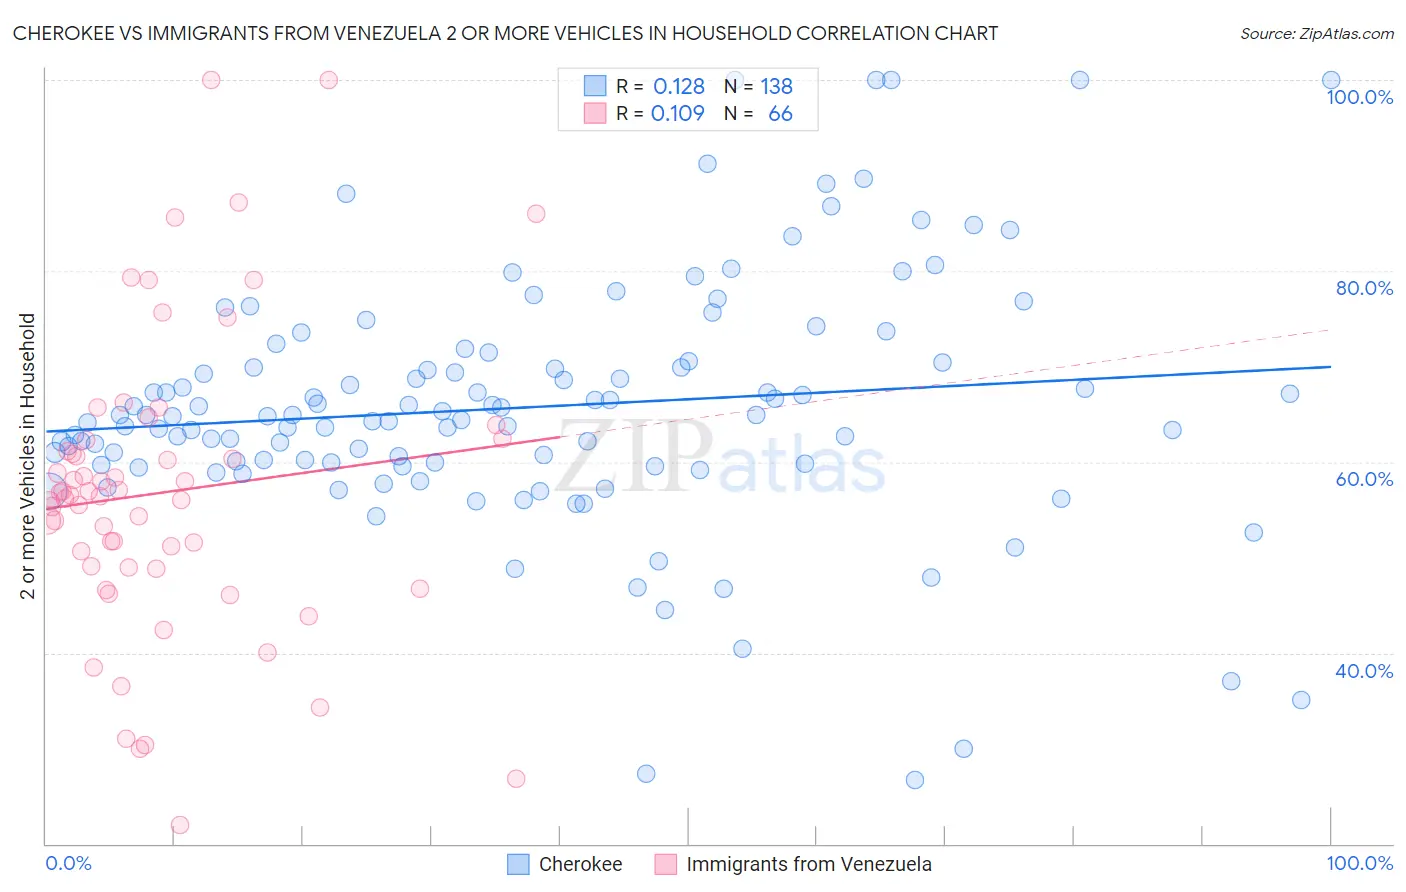
Cherokee vs Immigrants from Venezuela 2 or more Vehicles in Household Correlation Chart
The statistical analysis conducted on geographies consisting of 493,419,390 people shows a poor positive correlation between the proportion of Cherokee and percentage of households with 2 or more vehicles available in the United States with a correlation coefficient (R) of 0.128 and weighted average of 59.9%. Similarly, the statistical analysis conducted on geographies consisting of 287,795,975 people shows a poor positive correlation between the proportion of Immigrants from Venezuela and percentage of households with 2 or more vehicles available in the United States with a correlation coefficient (R) of 0.109 and weighted average of 55.8%, a difference of 7.2%.
2 or more Vehicles in Household Correlation Summary
| Measurement | Cherokee | Immigrants from Venezuela |
| Minimum | 26.7% | 22.0% |
| Maximum | 100.0% | 100.0% |
| Range | 73.3% | 78.0% |
| Mean | 65.7% | 56.8% |
| Median | 64.8% | 56.4% |
| Interquartile 25% (IQ1) | 59.8% | 49.0% |
| Interquartile 75% (IQ3) | 70.3% | 62.2% |
| Interquartile Range (IQR) | 10.6% | 13.3% |
| Standard Deviation (Sample) | 13.1% | 15.7% |
| Standard Deviation (Population) | 13.0% | 15.5% |
Similar Demographics by 2 or more Vehicles in Household
Demographics Similar to Cherokee by 2 or more Vehicles in Household
In terms of 2 or more vehicles in household, the demographic groups most similar to Cherokee are Northern European (59.9%, a difference of 0.020%), Malaysian (59.8%, a difference of 0.030%), Czechoslovakian (59.8%, a difference of 0.11%), French (59.8%, a difference of 0.17%), and Immigrants from Taiwan (59.7%, a difference of 0.21%).
| Demographics | Rating | Rank | 2 or more Vehicles in Household |
| Immigrants | Mexico | 100.0 /100 | #33 | Exceptional 60.2% |
| Spanish | 100.0 /100 | #34 | Exceptional 60.2% |
| Immigrants | Philippines | 100.0 /100 | #35 | Exceptional 60.1% |
| Chinese | 100.0 /100 | #36 | Exceptional 60.1% |
| Irish | 100.0 /100 | #37 | Exceptional 60.1% |
| Americans | 100.0 /100 | #38 | Exceptional 60.0% |
| British | 100.0 /100 | #39 | Exceptional 60.0% |
| Cherokee | 100.0 /100 | #40 | Exceptional 59.9% |
| Northern Europeans | 100.0 /100 | #41 | Exceptional 59.9% |
| Malaysians | 100.0 /100 | #42 | Exceptional 59.8% |
| Czechoslovakians | 100.0 /100 | #43 | Exceptional 59.8% |
| French | 100.0 /100 | #44 | Exceptional 59.8% |
| Immigrants | Taiwan | 100.0 /100 | #45 | Exceptional 59.7% |
| Immigrants | South Eastern Asia | 100.0 /100 | #46 | Exceptional 59.6% |
| Yaqui | 99.9 /100 | #47 | Exceptional 59.3% |
Demographics Similar to Immigrants from Venezuela by 2 or more Vehicles in Household
In terms of 2 or more vehicles in household, the demographic groups most similar to Immigrants from Venezuela are Ukrainian (55.8%, a difference of 0.0%), Immigrants from Lithuania (55.8%, a difference of 0.010%), Immigrants from Kuwait (55.8%, a difference of 0.030%), Lumbee (55.9%, a difference of 0.060%), and Tlingit-Haida (55.8%, a difference of 0.10%).
| Demographics | Rating | Rank | 2 or more Vehicles in Household |
| Immigrants | Moldova | 80.2 /100 | #148 | Excellent 56.1% |
| Chileans | 80.2 /100 | #149 | Excellent 56.1% |
| Nicaraguans | 79.9 /100 | #150 | Good 56.1% |
| Immigrants | Northern Europe | 78.7 /100 | #151 | Good 56.1% |
| Immigrants | Pakistan | 78.1 /100 | #152 | Good 56.1% |
| Lumbee | 71.9 /100 | #153 | Good 55.9% |
| Ukrainians | 70.8 /100 | #154 | Good 55.8% |
| Immigrants | Venezuela | 70.7 /100 | #155 | Good 55.8% |
| Immigrants | Lithuania | 70.4 /100 | #156 | Good 55.8% |
| Immigrants | Kuwait | 70.2 /100 | #157 | Good 55.8% |
| Tlingit-Haida | 68.5 /100 | #158 | Good 55.8% |
| Paiute | 68.0 /100 | #159 | Good 55.8% |
| Crow | 67.0 /100 | #160 | Good 55.7% |
| Colville | 61.1 /100 | #161 | Good 55.6% |
| German Russians | 60.9 /100 | #162 | Good 55.6% |