Hispanic or Latino vs Immigrants from Venezuela Female Disability
COMPARE
Hispanic or Latino
Immigrants from Venezuela
Female Disability
Female Disability Comparison
Hispanics or Latinos
Immigrants from Venezuela
12.5%
FEMALE DISABILITY
8.0/ 100
METRIC RATING
226th/ 347
METRIC RANK
10.9%
FEMALE DISABILITY
100.0/ 100
METRIC RATING
19th/ 347
METRIC RANK
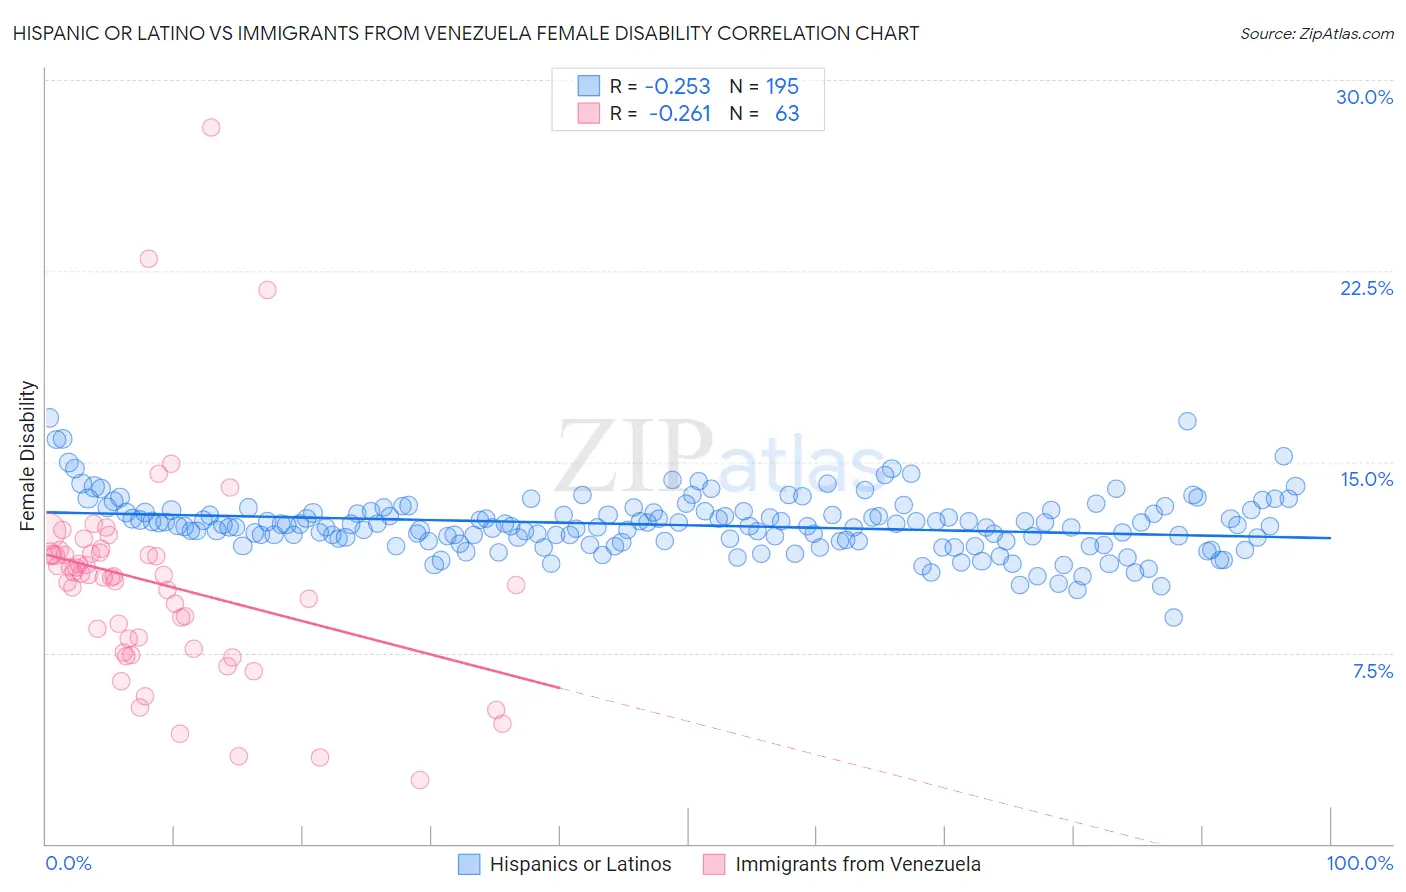
Hispanic or Latino vs Immigrants from Venezuela Female Disability Correlation Chart
The statistical analysis conducted on geographies consisting of 572,741,012 people shows a weak negative correlation between the proportion of Hispanics or Latinos and percentage of females with a disability in the United States with a correlation coefficient (R) of -0.253 and weighted average of 12.5%. Similarly, the statistical analysis conducted on geographies consisting of 287,842,421 people shows a weak negative correlation between the proportion of Immigrants from Venezuela and percentage of females with a disability in the United States with a correlation coefficient (R) of -0.261 and weighted average of 10.9%, a difference of 14.9%.
Female Disability Correlation Summary
| Measurement | Hispanic or Latino | Immigrants from Venezuela |
| Minimum | 8.9% | 2.5% |
| Maximum | 16.7% | 28.1% |
| Range | 7.8% | 25.6% |
| Mean | 12.5% | 10.2% |
| Median | 12.5% | 10.5% |
| Interquartile 25% (IQ1) | 11.9% | 7.7% |
| Interquartile 75% (IQ3) | 13.1% | 11.4% |
| Interquartile Range (IQR) | 1.2% | 3.7% |
| Standard Deviation (Sample) | 1.1% | 4.2% |
| Standard Deviation (Population) | 1.1% | 4.2% |
Similar Demographics by Female Disability
Demographics Similar to Hispanics or Latinos by Female Disability
In terms of female disability, the demographic groups most similar to Hispanics or Latinos are Assyrian/Chaldean/Syriac (12.5%, a difference of 0.010%), Immigrants from Cambodia (12.5%, a difference of 0.030%), Polish (12.5%, a difference of 0.050%), Hungarian (12.5%, a difference of 0.11%), and Immigrants from Belize (12.5%, a difference of 0.14%).
| Demographics | Rating | Rank | Female Disability |
| Europeans | 12.1 /100 | #219 | Poor 12.4% |
| Bahamians | 11.1 /100 | #220 | Poor 12.4% |
| Native Hawaiians | 10.8 /100 | #221 | Poor 12.4% |
| Italians | 10.7 /100 | #222 | Poor 12.4% |
| Guamanians/Chamorros | 9.5 /100 | #223 | Tragic 12.5% |
| Belizeans | 9.3 /100 | #224 | Tragic 12.5% |
| Poles | 8.4 /100 | #225 | Tragic 12.5% |
| Hispanics or Latinos | 8.0 /100 | #226 | Tragic 12.5% |
| Assyrians/Chaldeans/Syriacs | 8.0 /100 | #227 | Tragic 12.5% |
| Immigrants | Cambodia | 7.8 /100 | #228 | Tragic 12.5% |
| Hungarians | 7.2 /100 | #229 | Tragic 12.5% |
| Immigrants | Belize | 7.0 /100 | #230 | Tragic 12.5% |
| Belgians | 6.5 /100 | #231 | Tragic 12.5% |
| Immigrants | Somalia | 5.9 /100 | #232 | Tragic 12.5% |
| Immigrants | Iraq | 5.3 /100 | #233 | Tragic 12.5% |
Demographics Similar to Immigrants from Venezuela by Female Disability
In terms of female disability, the demographic groups most similar to Immigrants from Venezuela are Immigrants from Pakistan (10.9%, a difference of 0.17%), Immigrants from Iran (10.8%, a difference of 0.21%), Asian (10.9%, a difference of 0.54%), Indian (Asian) (10.8%, a difference of 0.60%), and Immigrants from Sri Lanka (10.9%, a difference of 0.66%).
| Demographics | Rating | Rank | Female Disability |
| Immigrants | Israel | 100.0 /100 | #12 | Exceptional 10.7% |
| Immigrants | Eastern Asia | 100.0 /100 | #13 | Exceptional 10.7% |
| Immigrants | China | 100.0 /100 | #14 | Exceptional 10.7% |
| Burmese | 100.0 /100 | #15 | Exceptional 10.7% |
| Okinawans | 100.0 /100 | #16 | Exceptional 10.8% |
| Indians (Asian) | 100.0 /100 | #17 | Exceptional 10.8% |
| Immigrants | Iran | 100.0 /100 | #18 | Exceptional 10.8% |
| Immigrants | Venezuela | 100.0 /100 | #19 | Exceptional 10.9% |
| Immigrants | Pakistan | 100.0 /100 | #20 | Exceptional 10.9% |
| Asians | 100.0 /100 | #21 | Exceptional 10.9% |
| Immigrants | Sri Lanka | 100.0 /100 | #22 | Exceptional 10.9% |
| Venezuelans | 100.0 /100 | #23 | Exceptional 11.0% |
| Immigrants | Argentina | 100.0 /100 | #24 | Exceptional 11.0% |
| Immigrants | Asia | 100.0 /100 | #25 | Exceptional 11.0% |
| Argentineans | 100.0 /100 | #26 | Exceptional 11.0% |