Immigrants from Belarus vs Immigrants from Venezuela 2 or more Vehicles in Household
COMPARE
Immigrants from Belarus
Immigrants from Venezuela
2 or more Vehicles in Household
2 or more Vehicles in Household Comparison
Immigrants from Belarus
Immigrants from Venezuela
47.9%
2 OR MORE VEHICLES IN HOUSEHOLD
0.0/ 100
METRIC RATING
311th/ 347
METRIC RANK
55.8%
2 OR MORE VEHICLES IN HOUSEHOLD
70.7/ 100
METRIC RATING
155th/ 347
METRIC RANK
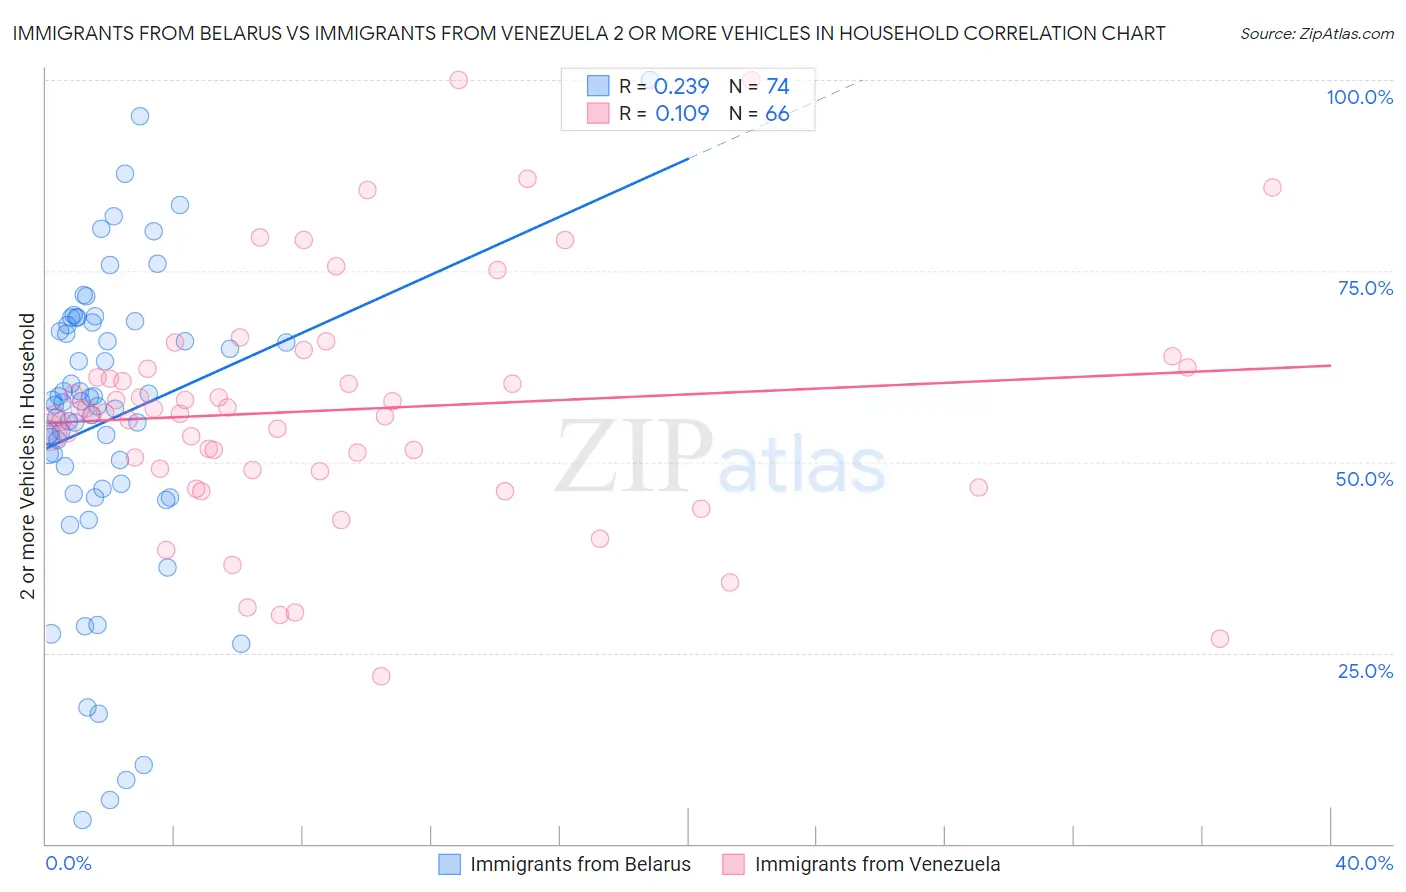
Immigrants from Belarus vs Immigrants from Venezuela 2 or more Vehicles in Household Correlation Chart
The statistical analysis conducted on geographies consisting of 150,189,140 people shows a weak positive correlation between the proportion of Immigrants from Belarus and percentage of households with 2 or more vehicles available in the United States with a correlation coefficient (R) of 0.239 and weighted average of 47.9%. Similarly, the statistical analysis conducted on geographies consisting of 287,795,975 people shows a poor positive correlation between the proportion of Immigrants from Venezuela and percentage of households with 2 or more vehicles available in the United States with a correlation coefficient (R) of 0.109 and weighted average of 55.8%, a difference of 16.5%.
2 or more Vehicles in Household Correlation Summary
| Measurement | Immigrants from Belarus | Immigrants from Venezuela |
| Minimum | 3.0% | 22.0% |
| Maximum | 100.0% | 100.0% |
| Range | 97.0% | 78.0% |
| Mean | 55.5% | 56.8% |
| Median | 57.6% | 56.4% |
| Interquartile 25% (IQ1) | 47.1% | 49.0% |
| Interquartile 75% (IQ3) | 67.9% | 62.2% |
| Interquartile Range (IQR) | 20.9% | 13.3% |
| Standard Deviation (Sample) | 19.6% | 15.7% |
| Standard Deviation (Population) | 19.4% | 15.5% |
Similar Demographics by 2 or more Vehicles in Household
Demographics Similar to Immigrants from Belarus by 2 or more Vehicles in Household
In terms of 2 or more vehicles in household, the demographic groups most similar to Immigrants from Belarus are Ghanaian (48.0%, a difference of 0.12%), Haitian (47.6%, a difference of 0.74%), U.S. Virgin Islander (47.5%, a difference of 0.91%), Immigrants from Ghana (47.4%, a difference of 1.1%), and Puerto Rican (47.1%, a difference of 1.7%).
| Demographics | Rating | Rank | 2 or more Vehicles in Household |
| Immigrants | Belize | 0.0 /100 | #304 | Tragic 49.9% |
| Immigrants | Western Africa | 0.0 /100 | #305 | Tragic 49.4% |
| Immigrants | Israel | 0.0 /100 | #306 | Tragic 49.2% |
| Hopi | 0.0 /100 | #307 | Tragic 49.0% |
| Albanians | 0.0 /100 | #308 | Tragic 49.0% |
| Moroccans | 0.0 /100 | #309 | Tragic 48.8% |
| Ghanaians | 0.0 /100 | #310 | Tragic 48.0% |
| Immigrants | Belarus | 0.0 /100 | #311 | Tragic 47.9% |
| Haitians | 0.0 /100 | #312 | Tragic 47.6% |
| U.S. Virgin Islanders | 0.0 /100 | #313 | Tragic 47.5% |
| Immigrants | Ghana | 0.0 /100 | #314 | Tragic 47.4% |
| Puerto Ricans | 0.0 /100 | #315 | Tragic 47.1% |
| Cape Verdeans | 0.0 /100 | #316 | Tragic 46.8% |
| Immigrants | Haiti | 0.0 /100 | #317 | Tragic 46.5% |
| Immigrants | Albania | 0.0 /100 | #318 | Tragic 46.0% |
Demographics Similar to Immigrants from Venezuela by 2 or more Vehicles in Household
In terms of 2 or more vehicles in household, the demographic groups most similar to Immigrants from Venezuela are Ukrainian (55.8%, a difference of 0.0%), Immigrants from Lithuania (55.8%, a difference of 0.010%), Immigrants from Kuwait (55.8%, a difference of 0.030%), Lumbee (55.9%, a difference of 0.060%), and Tlingit-Haida (55.8%, a difference of 0.10%).
| Demographics | Rating | Rank | 2 or more Vehicles in Household |
| Immigrants | Moldova | 80.2 /100 | #148 | Excellent 56.1% |
| Chileans | 80.2 /100 | #149 | Excellent 56.1% |
| Nicaraguans | 79.9 /100 | #150 | Good 56.1% |
| Immigrants | Northern Europe | 78.7 /100 | #151 | Good 56.1% |
| Immigrants | Pakistan | 78.1 /100 | #152 | Good 56.1% |
| Lumbee | 71.9 /100 | #153 | Good 55.9% |
| Ukrainians | 70.8 /100 | #154 | Good 55.8% |
| Immigrants | Venezuela | 70.7 /100 | #155 | Good 55.8% |
| Immigrants | Lithuania | 70.4 /100 | #156 | Good 55.8% |
| Immigrants | Kuwait | 70.2 /100 | #157 | Good 55.8% |
| Tlingit-Haida | 68.5 /100 | #158 | Good 55.8% |
| Paiute | 68.0 /100 | #159 | Good 55.8% |
| Crow | 67.0 /100 | #160 | Good 55.7% |
| Colville | 61.1 /100 | #161 | Good 55.6% |
| German Russians | 60.9 /100 | #162 | Good 55.6% |