Hispanic or Latino vs Immigrants from Costa Rica 2 or more Vehicles in Household
COMPARE
Hispanic or Latino
Immigrants from Costa Rica
2 or more Vehicles in Household
2 or more Vehicles in Household Comparison
Hispanics or Latinos
Immigrants from Costa Rica
57.9%
2 OR MORE VEHICLES IN HOUSEHOLD
99.0/ 100
METRIC RATING
90th/ 347
METRIC RANK
55.4%
2 OR MORE VEHICLES IN HOUSEHOLD
54.4/ 100
METRIC RATING
171st/ 347
METRIC RANK
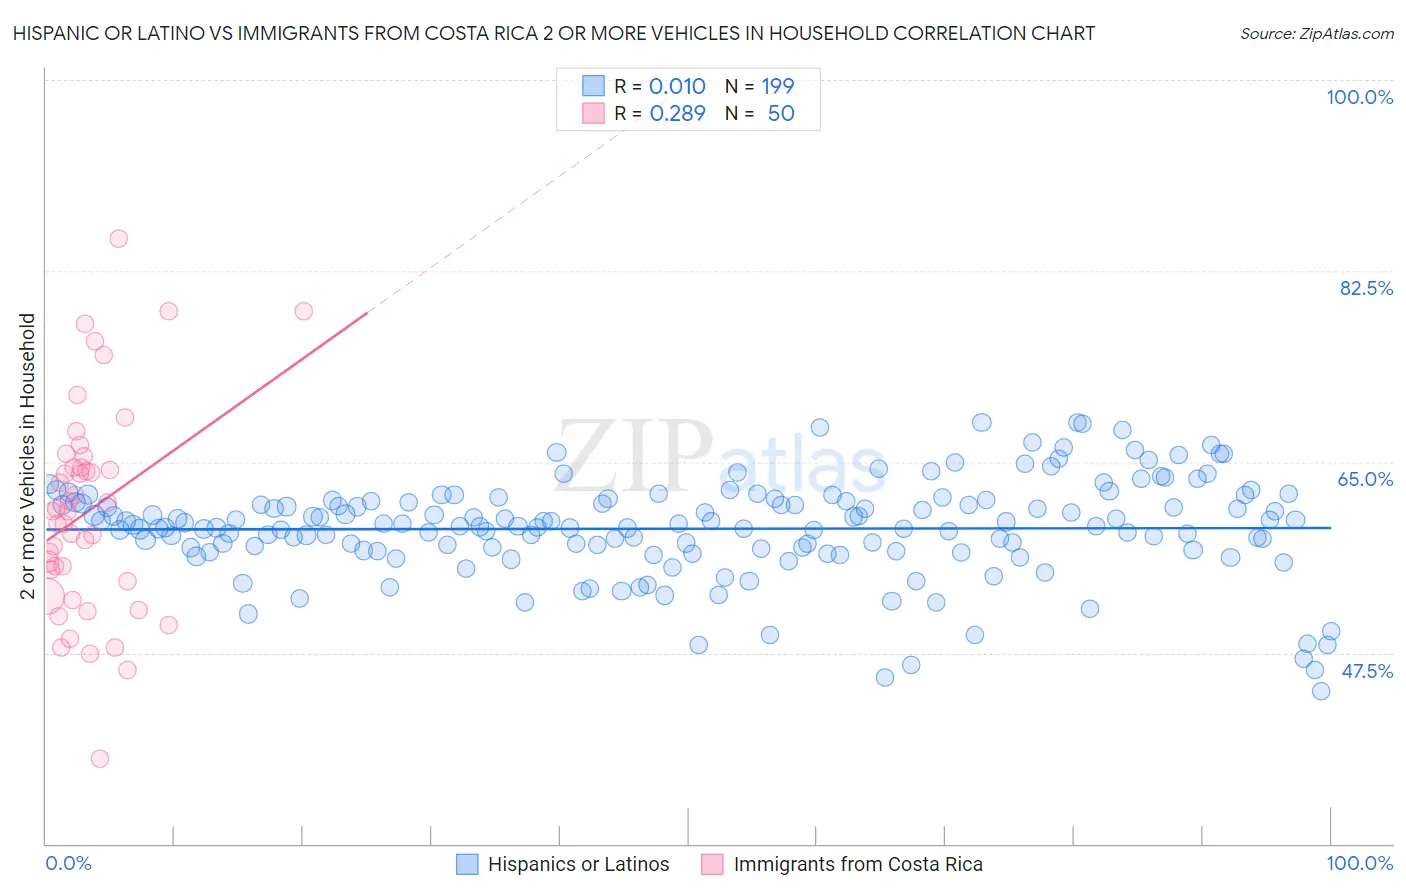
Hispanic or Latino vs Immigrants from Costa Rica 2 or more Vehicles in Household Correlation Chart
The statistical analysis conducted on geographies consisting of 560,775,190 people shows no correlation between the proportion of Hispanics or Latinos and percentage of households with 2 or more vehicles available in the United States with a correlation coefficient (R) of 0.010 and weighted average of 57.9%. Similarly, the statistical analysis conducted on geographies consisting of 204,253,183 people shows a weak positive correlation between the proportion of Immigrants from Costa Rica and percentage of households with 2 or more vehicles available in the United States with a correlation coefficient (R) of 0.289 and weighted average of 55.4%, a difference of 4.4%.
2 or more Vehicles in Household Correlation Summary
| Measurement | Hispanic or Latino | Immigrants from Costa Rica |
| Minimum | 44.0% | 37.8% |
| Maximum | 68.6% | 85.4% |
| Range | 24.6% | 47.6% |
| Mean | 58.9% | 60.5% |
| Median | 59.1% | 60.4% |
| Interquartile 25% (IQ1) | 56.9% | 54.1% |
| Interquartile 75% (IQ3) | 61.4% | 64.4% |
| Interquartile Range (IQR) | 4.5% | 10.4% |
| Standard Deviation (Sample) | 4.5% | 9.6% |
| Standard Deviation (Population) | 4.5% | 9.5% |
Similar Demographics by 2 or more Vehicles in Household
Demographics Similar to Hispanics or Latinos by 2 or more Vehicles in Household
In terms of 2 or more vehicles in household, the demographic groups most similar to Hispanics or Latinos are Immigrants from Germany (57.9%, a difference of 0.0%), Pakistani (57.9%, a difference of 0.030%), Shoshone (57.9%, a difference of 0.050%), Ottawa (57.9%, a difference of 0.060%), and Immigrants from Iran (57.9%, a difference of 0.070%).
| Demographics | Rating | Rank | 2 or more Vehicles in Household |
| Icelanders | 99.2 /100 | #83 | Exceptional 58.0% |
| Maltese | 99.2 /100 | #84 | Exceptional 58.0% |
| Slovaks | 99.2 /100 | #85 | Exceptional 58.0% |
| Potawatomi | 99.1 /100 | #86 | Exceptional 58.0% |
| Thais | 99.1 /100 | #87 | Exceptional 57.9% |
| Immigrants | Iran | 99.1 /100 | #88 | Exceptional 57.9% |
| Immigrants | Germany | 99.0 /100 | #89 | Exceptional 57.9% |
| Hispanics or Latinos | 99.0 /100 | #90 | Exceptional 57.9% |
| Pakistanis | 99.0 /100 | #91 | Exceptional 57.9% |
| Shoshone | 99.0 /100 | #92 | Exceptional 57.9% |
| Ottawa | 99.0 /100 | #93 | Exceptional 57.9% |
| Filipinos | 98.9 /100 | #94 | Exceptional 57.8% |
| Hmong | 98.9 /100 | #95 | Exceptional 57.8% |
| Burmese | 98.8 /100 | #96 | Exceptional 57.8% |
| Slavs | 98.8 /100 | #97 | Exceptional 57.8% |
Demographics Similar to Immigrants from Costa Rica by 2 or more Vehicles in Household
In terms of 2 or more vehicles in household, the demographic groups most similar to Immigrants from Costa Rica are Romanian (55.5%, a difference of 0.060%), Immigrants from Austria (55.5%, a difference of 0.080%), French American Indian (55.5%, a difference of 0.090%), Immigrants from Nicaragua (55.4%, a difference of 0.11%), and Immigrants from Western Europe (55.4%, a difference of 0.12%).
| Demographics | Rating | Rank | 2 or more Vehicles in Household |
| Dutch West Indians | 59.8 /100 | #164 | Average 55.6% |
| Immigrants | El Salvador | 59.4 /100 | #165 | Average 55.6% |
| Immigrants | Sri Lanka | 58.3 /100 | #166 | Average 55.5% |
| Kenyans | 58.1 /100 | #167 | Average 55.5% |
| French American Indians | 56.7 /100 | #168 | Average 55.5% |
| Immigrants | Austria | 56.3 /100 | #169 | Average 55.5% |
| Romanians | 55.8 /100 | #170 | Average 55.5% |
| Immigrants | Costa Rica | 54.4 /100 | #171 | Average 55.4% |
| Immigrants | Nicaragua | 51.6 /100 | #172 | Average 55.4% |
| Immigrants | Western Europe | 51.4 /100 | #173 | Average 55.4% |
| Navajo | 50.0 /100 | #174 | Average 55.3% |
| Immigrants | Denmark | 49.4 /100 | #175 | Average 55.3% |
| Immigrants | Cuba | 47.0 /100 | #176 | Average 55.3% |
| Menominee | 46.2 /100 | #177 | Average 55.3% |
| Immigrants | Sweden | 45.3 /100 | #178 | Average 55.2% |