Hispanic or Latino vs Estonian 2 or more Vehicles in Household
COMPARE
Hispanic or Latino
Estonian
2 or more Vehicles in Household
2 or more Vehicles in Household Comparison
Hispanics or Latinos
Estonians
57.9%
2 OR MORE VEHICLES IN HOUSEHOLD
99.0/ 100
METRIC RATING
90th/ 347
METRIC RANK
56.6%
2 OR MORE VEHICLES IN HOUSEHOLD
90.9/ 100
METRIC RATING
126th/ 347
METRIC RANK
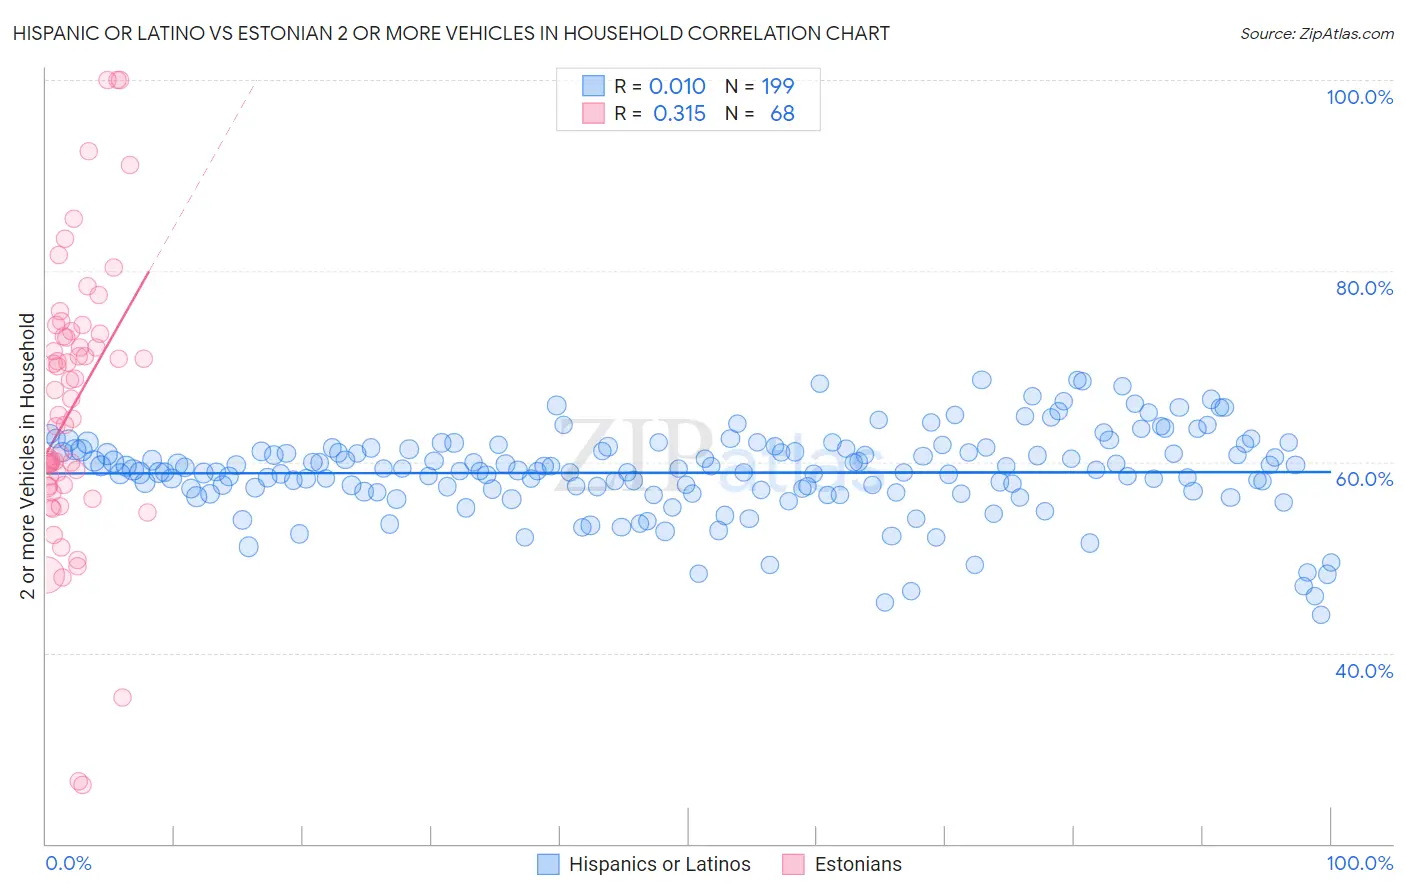
Hispanic or Latino vs Estonian 2 or more Vehicles in Household Correlation Chart
The statistical analysis conducted on geographies consisting of 560,775,190 people shows no correlation between the proportion of Hispanics or Latinos and percentage of households with 2 or more vehicles available in the United States with a correlation coefficient (R) of 0.010 and weighted average of 57.9%. Similarly, the statistical analysis conducted on geographies consisting of 123,500,786 people shows a mild positive correlation between the proportion of Estonians and percentage of households with 2 or more vehicles available in the United States with a correlation coefficient (R) of 0.315 and weighted average of 56.6%, a difference of 2.3%.
2 or more Vehicles in Household Correlation Summary
| Measurement | Hispanic or Latino | Estonian |
| Minimum | 44.0% | 26.1% |
| Maximum | 68.6% | 100.0% |
| Range | 24.6% | 73.9% |
| Mean | 58.9% | 65.9% |
| Median | 59.1% | 65.7% |
| Interquartile 25% (IQ1) | 56.9% | 57.5% |
| Interquartile 75% (IQ3) | 61.4% | 73.3% |
| Interquartile Range (IQR) | 4.5% | 15.7% |
| Standard Deviation (Sample) | 4.5% | 14.5% |
| Standard Deviation (Population) | 4.5% | 14.4% |
Similar Demographics by 2 or more Vehicles in Household
Demographics Similar to Hispanics or Latinos by 2 or more Vehicles in Household
In terms of 2 or more vehicles in household, the demographic groups most similar to Hispanics or Latinos are Immigrants from Germany (57.9%, a difference of 0.0%), Pakistani (57.9%, a difference of 0.030%), Shoshone (57.9%, a difference of 0.050%), Ottawa (57.9%, a difference of 0.060%), and Immigrants from Iran (57.9%, a difference of 0.070%).
| Demographics | Rating | Rank | 2 or more Vehicles in Household |
| Icelanders | 99.2 /100 | #83 | Exceptional 58.0% |
| Maltese | 99.2 /100 | #84 | Exceptional 58.0% |
| Slovaks | 99.2 /100 | #85 | Exceptional 58.0% |
| Potawatomi | 99.1 /100 | #86 | Exceptional 58.0% |
| Thais | 99.1 /100 | #87 | Exceptional 57.9% |
| Immigrants | Iran | 99.1 /100 | #88 | Exceptional 57.9% |
| Immigrants | Germany | 99.0 /100 | #89 | Exceptional 57.9% |
| Hispanics or Latinos | 99.0 /100 | #90 | Exceptional 57.9% |
| Pakistanis | 99.0 /100 | #91 | Exceptional 57.9% |
| Shoshone | 99.0 /100 | #92 | Exceptional 57.9% |
| Ottawa | 99.0 /100 | #93 | Exceptional 57.9% |
| Filipinos | 98.9 /100 | #94 | Exceptional 57.8% |
| Hmong | 98.9 /100 | #95 | Exceptional 57.8% |
| Burmese | 98.8 /100 | #96 | Exceptional 57.8% |
| Slavs | 98.8 /100 | #97 | Exceptional 57.8% |
Demographics Similar to Estonians by 2 or more Vehicles in Household
In terms of 2 or more vehicles in household, the demographic groups most similar to Estonians are Immigrants from Thailand (56.6%, a difference of 0.030%), Immigrants from South Central Asia (56.6%, a difference of 0.050%), Ute (56.6%, a difference of 0.070%), Tsimshian (56.7%, a difference of 0.080%), and New Zealander (56.7%, a difference of 0.10%).
| Demographics | Rating | Rank | 2 or more Vehicles in Household |
| Natives/Alaskans | 95.0 /100 | #119 | Exceptional 57.0% |
| Costa Ricans | 94.7 /100 | #120 | Exceptional 56.9% |
| Sioux | 93.8 /100 | #121 | Exceptional 56.8% |
| Immigrants | South Africa | 92.5 /100 | #122 | Exceptional 56.7% |
| Australians | 91.8 /100 | #123 | Exceptional 56.7% |
| New Zealanders | 91.8 /100 | #124 | Exceptional 56.7% |
| Tsimshian | 91.6 /100 | #125 | Exceptional 56.7% |
| Estonians | 90.9 /100 | #126 | Exceptional 56.6% |
| Immigrants | Thailand | 90.7 /100 | #127 | Exceptional 56.6% |
| Immigrants | South Central Asia | 90.5 /100 | #128 | Exceptional 56.6% |
| Ute | 90.4 /100 | #129 | Exceptional 56.6% |
| Yugoslavians | 90.0 /100 | #130 | Exceptional 56.6% |
| Bulgarians | 89.7 /100 | #131 | Excellent 56.5% |
| Hungarians | 89.1 /100 | #132 | Excellent 56.5% |
| Comanche | 88.4 /100 | #133 | Excellent 56.5% |