Hispanic or Latino vs Immigrants from Ghana 2 or more Vehicles in Household
COMPARE
Hispanic or Latino
Immigrants from Ghana
2 or more Vehicles in Household
2 or more Vehicles in Household Comparison
Hispanics or Latinos
Immigrants from Ghana
57.9%
2 OR MORE VEHICLES IN HOUSEHOLD
99.0/ 100
METRIC RATING
90th/ 347
METRIC RANK
47.4%
2 OR MORE VEHICLES IN HOUSEHOLD
0.0/ 100
METRIC RATING
314th/ 347
METRIC RANK
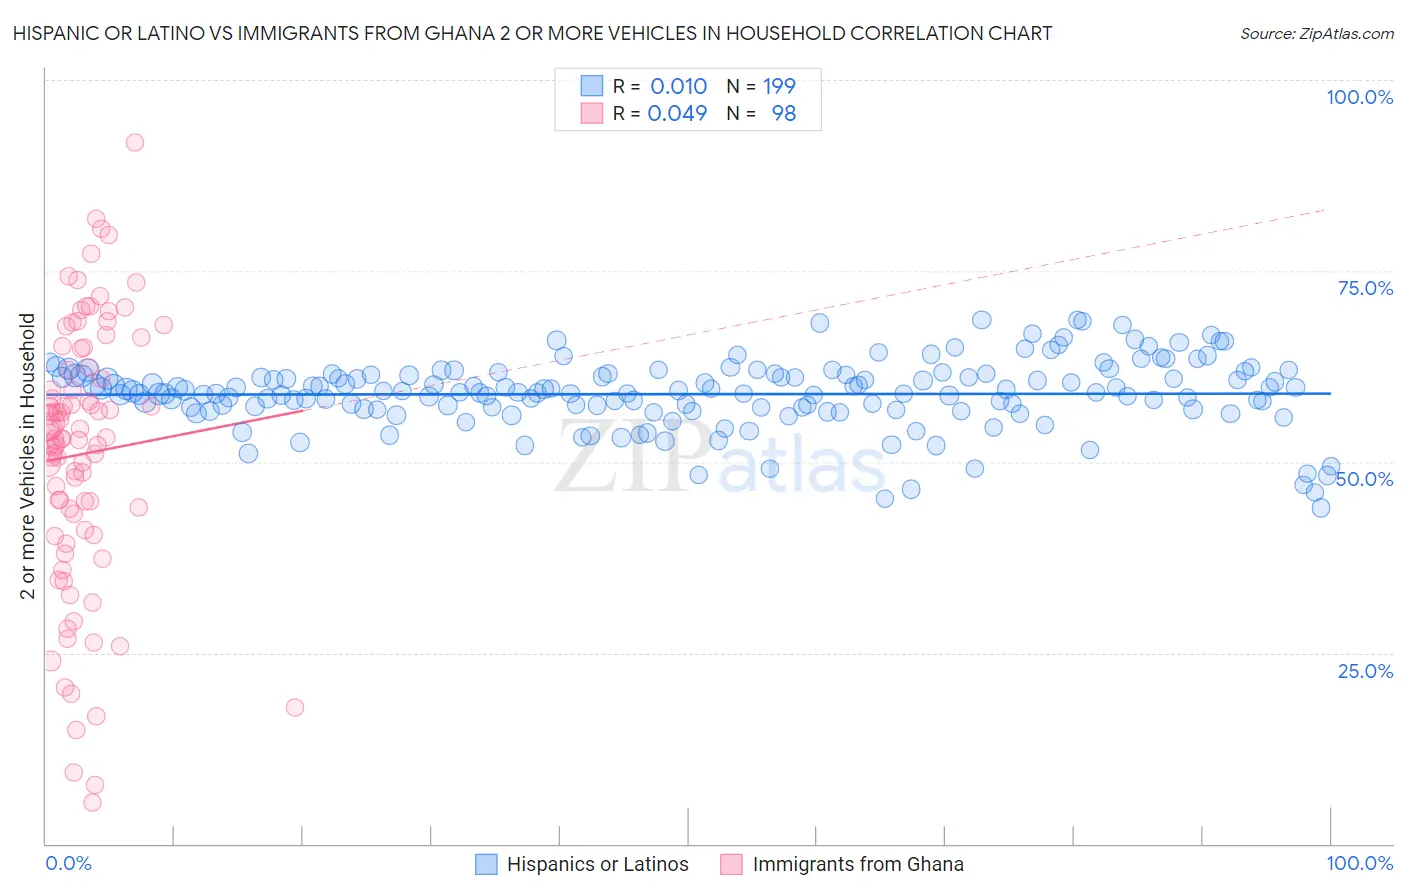
Hispanic or Latino vs Immigrants from Ghana 2 or more Vehicles in Household Correlation Chart
The statistical analysis conducted on geographies consisting of 560,775,190 people shows no correlation between the proportion of Hispanics or Latinos and percentage of households with 2 or more vehicles available in the United States with a correlation coefficient (R) of 0.010 and weighted average of 57.9%. Similarly, the statistical analysis conducted on geographies consisting of 199,813,535 people shows no correlation between the proportion of Immigrants from Ghana and percentage of households with 2 or more vehicles available in the United States with a correlation coefficient (R) of 0.049 and weighted average of 47.4%, a difference of 22.2%.
2 or more Vehicles in Household Correlation Summary
| Measurement | Hispanic or Latino | Immigrants from Ghana |
| Minimum | 44.0% | 5.4% |
| Maximum | 68.6% | 91.9% |
| Range | 24.6% | 86.4% |
| Mean | 58.9% | 51.0% |
| Median | 59.1% | 53.0% |
| Interquartile 25% (IQ1) | 56.9% | 41.0% |
| Interquartile 75% (IQ3) | 61.4% | 62.3% |
| Interquartile Range (IQR) | 4.5% | 21.3% |
| Standard Deviation (Sample) | 4.5% | 17.5% |
| Standard Deviation (Population) | 4.5% | 17.5% |
Similar Demographics by 2 or more Vehicles in Household
Demographics Similar to Hispanics or Latinos by 2 or more Vehicles in Household
In terms of 2 or more vehicles in household, the demographic groups most similar to Hispanics or Latinos are Immigrants from Germany (57.9%, a difference of 0.0%), Pakistani (57.9%, a difference of 0.030%), Shoshone (57.9%, a difference of 0.050%), Ottawa (57.9%, a difference of 0.060%), and Immigrants from Iran (57.9%, a difference of 0.070%).
| Demographics | Rating | Rank | 2 or more Vehicles in Household |
| Icelanders | 99.2 /100 | #83 | Exceptional 58.0% |
| Maltese | 99.2 /100 | #84 | Exceptional 58.0% |
| Slovaks | 99.2 /100 | #85 | Exceptional 58.0% |
| Potawatomi | 99.1 /100 | #86 | Exceptional 58.0% |
| Thais | 99.1 /100 | #87 | Exceptional 57.9% |
| Immigrants | Iran | 99.1 /100 | #88 | Exceptional 57.9% |
| Immigrants | Germany | 99.0 /100 | #89 | Exceptional 57.9% |
| Hispanics or Latinos | 99.0 /100 | #90 | Exceptional 57.9% |
| Pakistanis | 99.0 /100 | #91 | Exceptional 57.9% |
| Shoshone | 99.0 /100 | #92 | Exceptional 57.9% |
| Ottawa | 99.0 /100 | #93 | Exceptional 57.9% |
| Filipinos | 98.9 /100 | #94 | Exceptional 57.8% |
| Hmong | 98.9 /100 | #95 | Exceptional 57.8% |
| Burmese | 98.8 /100 | #96 | Exceptional 57.8% |
| Slavs | 98.8 /100 | #97 | Exceptional 57.8% |
Demographics Similar to Immigrants from Ghana by 2 or more Vehicles in Household
In terms of 2 or more vehicles in household, the demographic groups most similar to Immigrants from Ghana are U.S. Virgin Islander (47.5%, a difference of 0.22%), Haitian (47.6%, a difference of 0.40%), Puerto Rican (47.1%, a difference of 0.57%), Immigrants from Belarus (47.9%, a difference of 1.1%), and Ghanaian (48.0%, a difference of 1.3%).
| Demographics | Rating | Rank | 2 or more Vehicles in Household |
| Hopi | 0.0 /100 | #307 | Tragic 49.0% |
| Albanians | 0.0 /100 | #308 | Tragic 49.0% |
| Moroccans | 0.0 /100 | #309 | Tragic 48.8% |
| Ghanaians | 0.0 /100 | #310 | Tragic 48.0% |
| Immigrants | Belarus | 0.0 /100 | #311 | Tragic 47.9% |
| Haitians | 0.0 /100 | #312 | Tragic 47.6% |
| U.S. Virgin Islanders | 0.0 /100 | #313 | Tragic 47.5% |
| Immigrants | Ghana | 0.0 /100 | #314 | Tragic 47.4% |
| Puerto Ricans | 0.0 /100 | #315 | Tragic 47.1% |
| Cape Verdeans | 0.0 /100 | #316 | Tragic 46.8% |
| Immigrants | Haiti | 0.0 /100 | #317 | Tragic 46.5% |
| Immigrants | Albania | 0.0 /100 | #318 | Tragic 46.0% |
| Jamaicans | 0.0 /100 | #319 | Tragic 45.8% |
| Soviet Union | 0.0 /100 | #320 | Tragic 45.7% |
| Immigrants | Jamaica | 0.0 /100 | #321 | Tragic 44.5% |