Immigrants from Argentina vs Estonian 2 or more Vehicles in Household
COMPARE
Immigrants from Argentina
Estonian
2 or more Vehicles in Household
2 or more Vehicles in Household Comparison
Immigrants from Argentina
Estonians
53.9%
2 OR MORE VEHICLES IN HOUSEHOLD
6.8/ 100
METRIC RATING
218th/ 347
METRIC RANK
56.6%
2 OR MORE VEHICLES IN HOUSEHOLD
90.9/ 100
METRIC RATING
126th/ 347
METRIC RANK
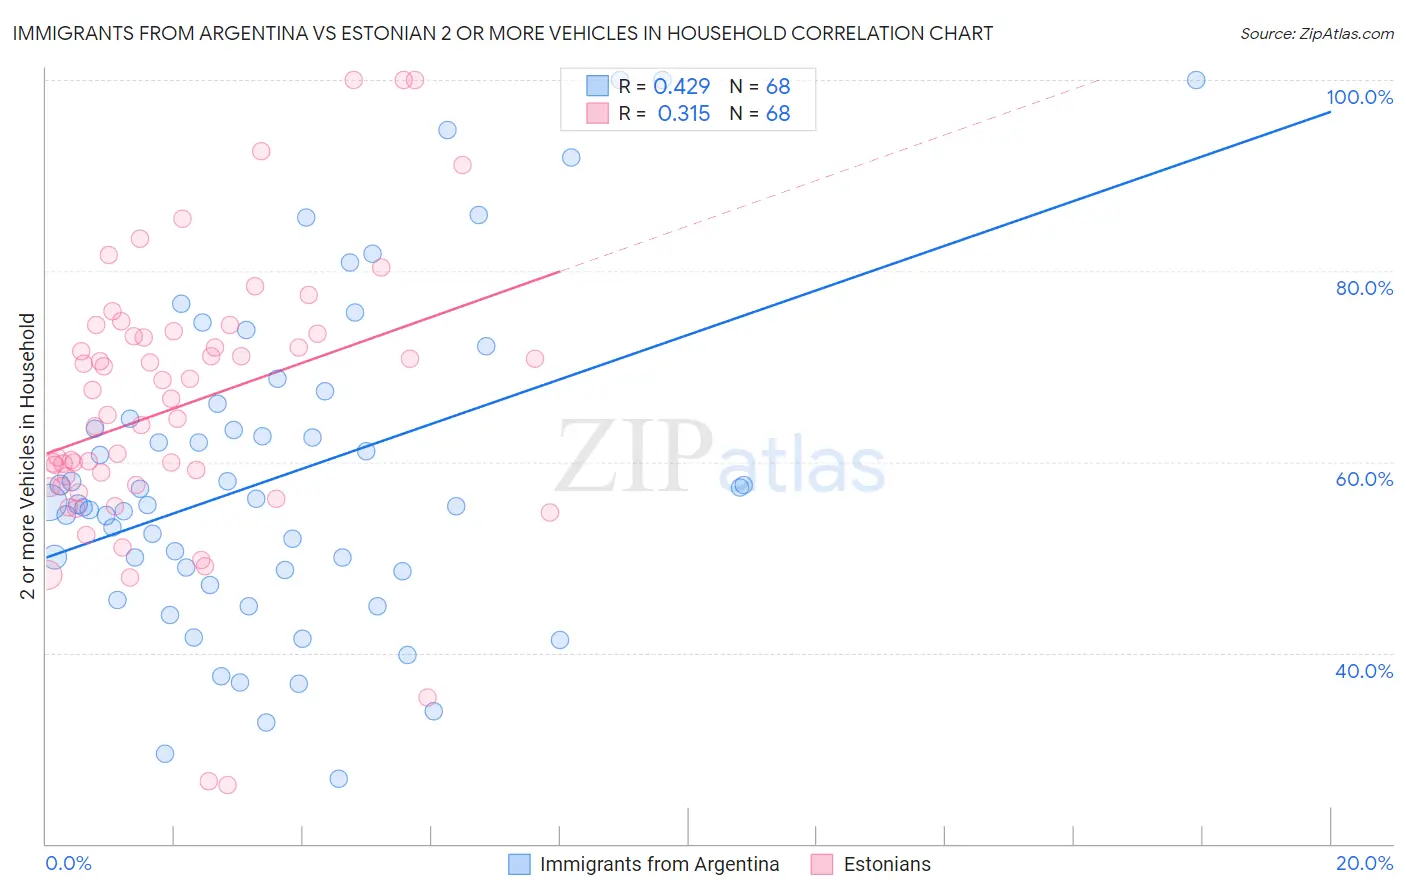
Immigrants from Argentina vs Estonian 2 or more Vehicles in Household Correlation Chart
The statistical analysis conducted on geographies consisting of 264,362,205 people shows a moderate positive correlation between the proportion of Immigrants from Argentina and percentage of households with 2 or more vehicles available in the United States with a correlation coefficient (R) of 0.429 and weighted average of 53.9%. Similarly, the statistical analysis conducted on geographies consisting of 123,500,786 people shows a mild positive correlation between the proportion of Estonians and percentage of households with 2 or more vehicles available in the United States with a correlation coefficient (R) of 0.315 and weighted average of 56.6%, a difference of 5.0%.
2 or more Vehicles in Household Correlation Summary
| Measurement | Immigrants from Argentina | Estonian |
| Minimum | 26.8% | 26.1% |
| Maximum | 100.0% | 100.0% |
| Range | 73.2% | 73.9% |
| Mean | 58.6% | 65.9% |
| Median | 55.6% | 65.7% |
| Interquartile 25% (IQ1) | 48.6% | 57.5% |
| Interquartile 75% (IQ3) | 65.3% | 73.3% |
| Interquartile Range (IQR) | 16.6% | 15.7% |
| Standard Deviation (Sample) | 16.9% | 14.5% |
| Standard Deviation (Population) | 16.8% | 14.4% |
Similar Demographics by 2 or more Vehicles in Household
Demographics Similar to Immigrants from Argentina by 2 or more Vehicles in Household
In terms of 2 or more vehicles in household, the demographic groups most similar to Immigrants from Argentina are Immigrants from Burma/Myanmar (53.9%, a difference of 0.050%), South American Indian (53.9%, a difference of 0.060%), Taiwanese (53.9%, a difference of 0.080%), Immigrants from Singapore (53.9%, a difference of 0.10%), and Kiowa (53.9%, a difference of 0.11%).
| Demographics | Rating | Rank | 2 or more Vehicles in Household |
| Immigrants | Hungary | 11.3 /100 | #211 | Poor 54.2% |
| Immigrants | Chile | 11.1 /100 | #212 | Poor 54.2% |
| Guatemalans | 9.6 /100 | #213 | Tragic 54.1% |
| Immigrants | Czechoslovakia | 9.4 /100 | #214 | Tragic 54.1% |
| Aleuts | 9.3 /100 | #215 | Tragic 54.1% |
| Immigrants | Western Asia | 9.3 /100 | #216 | Tragic 54.1% |
| Immigrants | Burma/Myanmar | 7.1 /100 | #217 | Tragic 53.9% |
| Immigrants | Argentina | 6.8 /100 | #218 | Tragic 53.9% |
| South American Indians | 6.5 /100 | #219 | Tragic 53.9% |
| Taiwanese | 6.3 /100 | #220 | Tragic 53.9% |
| Immigrants | Singapore | 6.3 /100 | #221 | Tragic 53.9% |
| Kiowa | 6.2 /100 | #222 | Tragic 53.9% |
| Immigrants | Bosnia and Herzegovina | 5.5 /100 | #223 | Tragic 53.8% |
| Brazilians | 5.3 /100 | #224 | Tragic 53.8% |
| Immigrants | Egypt | 5.2 /100 | #225 | Tragic 53.8% |
Demographics Similar to Estonians by 2 or more Vehicles in Household
In terms of 2 or more vehicles in household, the demographic groups most similar to Estonians are Immigrants from Thailand (56.6%, a difference of 0.030%), Immigrants from South Central Asia (56.6%, a difference of 0.050%), Ute (56.6%, a difference of 0.070%), Tsimshian (56.7%, a difference of 0.080%), and New Zealander (56.7%, a difference of 0.10%).
| Demographics | Rating | Rank | 2 or more Vehicles in Household |
| Natives/Alaskans | 95.0 /100 | #119 | Exceptional 57.0% |
| Costa Ricans | 94.7 /100 | #120 | Exceptional 56.9% |
| Sioux | 93.8 /100 | #121 | Exceptional 56.8% |
| Immigrants | South Africa | 92.5 /100 | #122 | Exceptional 56.7% |
| Australians | 91.8 /100 | #123 | Exceptional 56.7% |
| New Zealanders | 91.8 /100 | #124 | Exceptional 56.7% |
| Tsimshian | 91.6 /100 | #125 | Exceptional 56.7% |
| Estonians | 90.9 /100 | #126 | Exceptional 56.6% |
| Immigrants | Thailand | 90.7 /100 | #127 | Exceptional 56.6% |
| Immigrants | South Central Asia | 90.5 /100 | #128 | Exceptional 56.6% |
| Ute | 90.4 /100 | #129 | Exceptional 56.6% |
| Yugoslavians | 90.0 /100 | #130 | Exceptional 56.6% |
| Bulgarians | 89.7 /100 | #131 | Excellent 56.5% |
| Hungarians | 89.1 /100 | #132 | Excellent 56.5% |
| Comanche | 88.4 /100 | #133 | Excellent 56.5% |