Hispanic or Latino vs Estonian Male Disability
COMPARE
Hispanic or Latino
Estonian
Male Disability
Male Disability Comparison
Hispanics or Latinos
Estonians
11.8%
MALE DISABILITY
2.3/ 100
METRIC RATING
228th/ 347
METRIC RANK
11.4%
MALE DISABILITY
26.8/ 100
METRIC RATING
188th/ 347
METRIC RANK
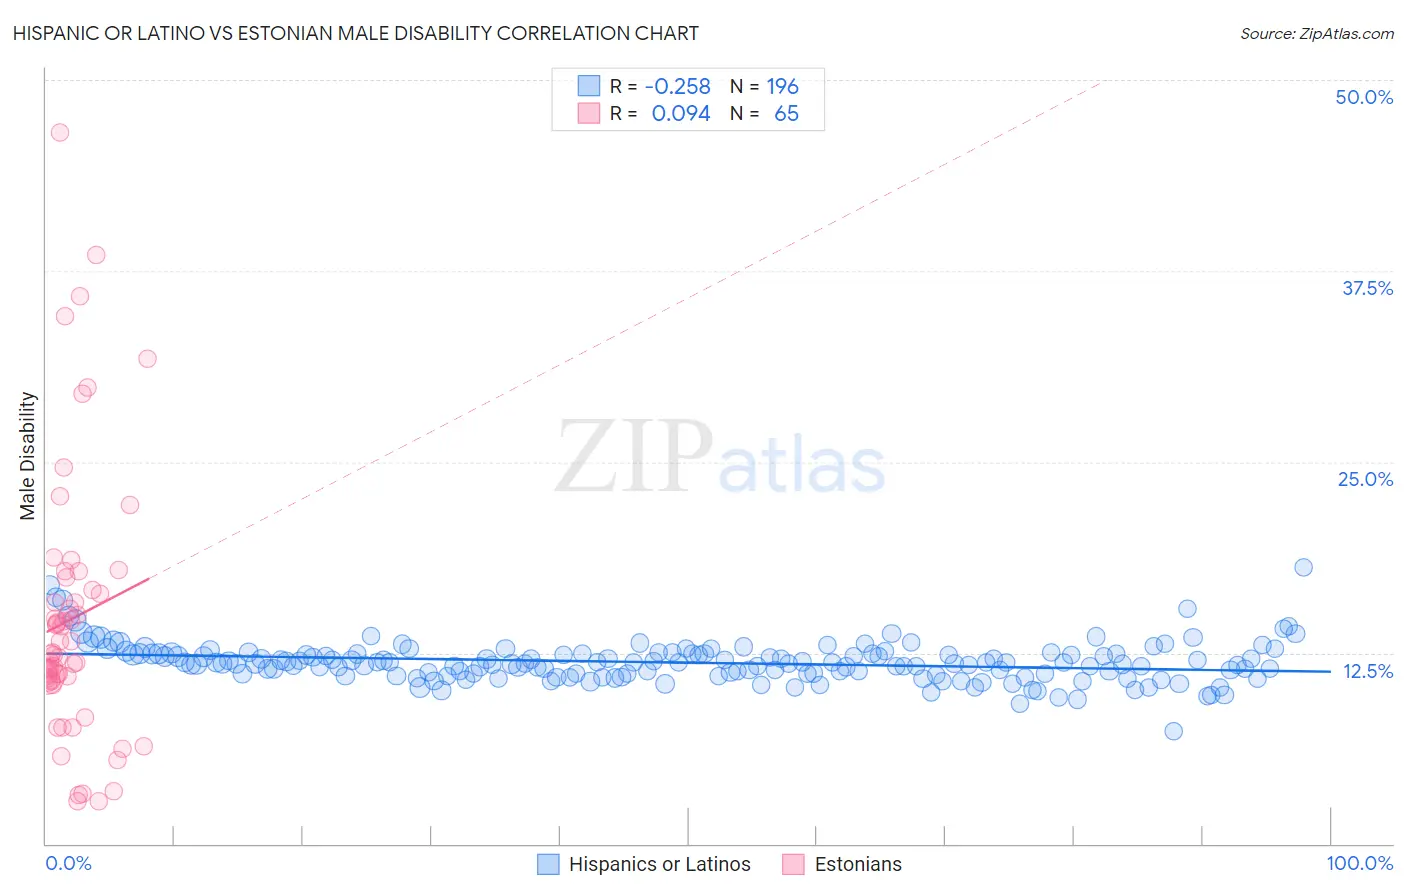
Hispanic or Latino vs Estonian Male Disability Correlation Chart
The statistical analysis conducted on geographies consisting of 573,649,400 people shows a weak negative correlation between the proportion of Hispanics or Latinos and percentage of males with a disability in the United States with a correlation coefficient (R) of -0.258 and weighted average of 11.8%. Similarly, the statistical analysis conducted on geographies consisting of 123,527,387 people shows a slight positive correlation between the proportion of Estonians and percentage of males with a disability in the United States with a correlation coefficient (R) of 0.094 and weighted average of 11.4%, a difference of 3.7%.
Male Disability Correlation Summary
| Measurement | Hispanic or Latino | Estonian |
| Minimum | 7.3% | 2.8% |
| Maximum | 18.1% | 46.6% |
| Range | 10.7% | 43.8% |
| Mean | 11.9% | 14.7% |
| Median | 11.8% | 12.5% |
| Interquartile 25% (IQ1) | 11.1% | 10.7% |
| Interquartile 75% (IQ3) | 12.4% | 17.0% |
| Interquartile Range (IQR) | 1.3% | 6.3% |
| Standard Deviation (Sample) | 1.3% | 8.7% |
| Standard Deviation (Population) | 1.3% | 8.7% |
Similar Demographics by Male Disability
Demographics Similar to Hispanics or Latinos by Male Disability
In terms of male disability, the demographic groups most similar to Hispanics or Latinos are Bermudan (11.8%, a difference of 0.030%), Austrian (11.8%, a difference of 0.080%), Croatian (11.8%, a difference of 0.12%), Subsaharan African (11.8%, a difference of 0.26%), and Dominican (11.8%, a difference of 0.32%).
| Demographics | Rating | Rank | Male Disability |
| Immigrants | Congo | 3.7 /100 | #221 | Tragic 11.7% |
| Alsatians | 3.3 /100 | #222 | Tragic 11.7% |
| Immigrants | Bahamas | 3.2 /100 | #223 | Tragic 11.7% |
| Japanese | 3.1 /100 | #224 | Tragic 11.7% |
| Liberians | 3.1 /100 | #225 | Tragic 11.8% |
| Sub-Saharan Africans | 2.8 /100 | #226 | Tragic 11.8% |
| Austrians | 2.5 /100 | #227 | Tragic 11.8% |
| Hispanics or Latinos | 2.3 /100 | #228 | Tragic 11.8% |
| Bermudans | 2.3 /100 | #229 | Tragic 11.8% |
| Croatians | 2.1 /100 | #230 | Tragic 11.8% |
| Dominicans | 1.8 /100 | #231 | Tragic 11.8% |
| Malaysians | 1.8 /100 | #232 | Tragic 11.8% |
| Mexicans | 1.7 /100 | #233 | Tragic 11.8% |
| Immigrants | Canada | 1.6 /100 | #234 | Tragic 11.9% |
| Immigrants | North America | 1.5 /100 | #235 | Tragic 11.9% |
Demographics Similar to Estonians by Male Disability
In terms of male disability, the demographic groups most similar to Estonians are Immigrants from Austria (11.4%, a difference of 0.040%), Immigrants from Zaire (11.4%, a difference of 0.060%), Immigrants from Netherlands (11.4%, a difference of 0.060%), Immigrants from Bosnia and Herzegovina (11.4%, a difference of 0.10%), and Pakistani (11.3%, a difference of 0.24%).
| Demographics | Rating | Rank | Male Disability |
| Immigrants | Senegal | 34.4 /100 | #181 | Fair 11.3% |
| Immigrants | Belize | 33.7 /100 | #182 | Fair 11.3% |
| Immigrants | Central America | 32.9 /100 | #183 | Fair 11.3% |
| Iraqis | 30.5 /100 | #184 | Fair 11.3% |
| Pakistanis | 30.3 /100 | #185 | Fair 11.3% |
| Immigrants | Zaire | 27.6 /100 | #186 | Fair 11.4% |
| Immigrants | Austria | 27.3 /100 | #187 | Fair 11.4% |
| Estonians | 26.8 /100 | #188 | Fair 11.4% |
| Immigrants | Netherlands | 25.9 /100 | #189 | Fair 11.4% |
| Immigrants | Bosnia and Herzegovina | 25.4 /100 | #190 | Fair 11.4% |
| Senegalese | 23.2 /100 | #191 | Fair 11.4% |
| Assyrians/Chaldeans/Syriacs | 23.2 /100 | #192 | Fair 11.4% |
| Greeks | 22.2 /100 | #193 | Fair 11.4% |
| Belizeans | 21.2 /100 | #194 | Fair 11.4% |
| Immigrants | Oceania | 20.9 /100 | #195 | Fair 11.4% |