U.S. Virgin Islander vs Estonian 2 or more Vehicles in Household
COMPARE
U.S. Virgin Islander
Estonian
2 or more Vehicles in Household
2 or more Vehicles in Household Comparison
U.S. Virgin Islanders
Estonians
47.5%
2 OR MORE VEHICLES IN HOUSEHOLD
0.0/ 100
METRIC RATING
313th/ 347
METRIC RANK
56.6%
2 OR MORE VEHICLES IN HOUSEHOLD
90.9/ 100
METRIC RATING
126th/ 347
METRIC RANK
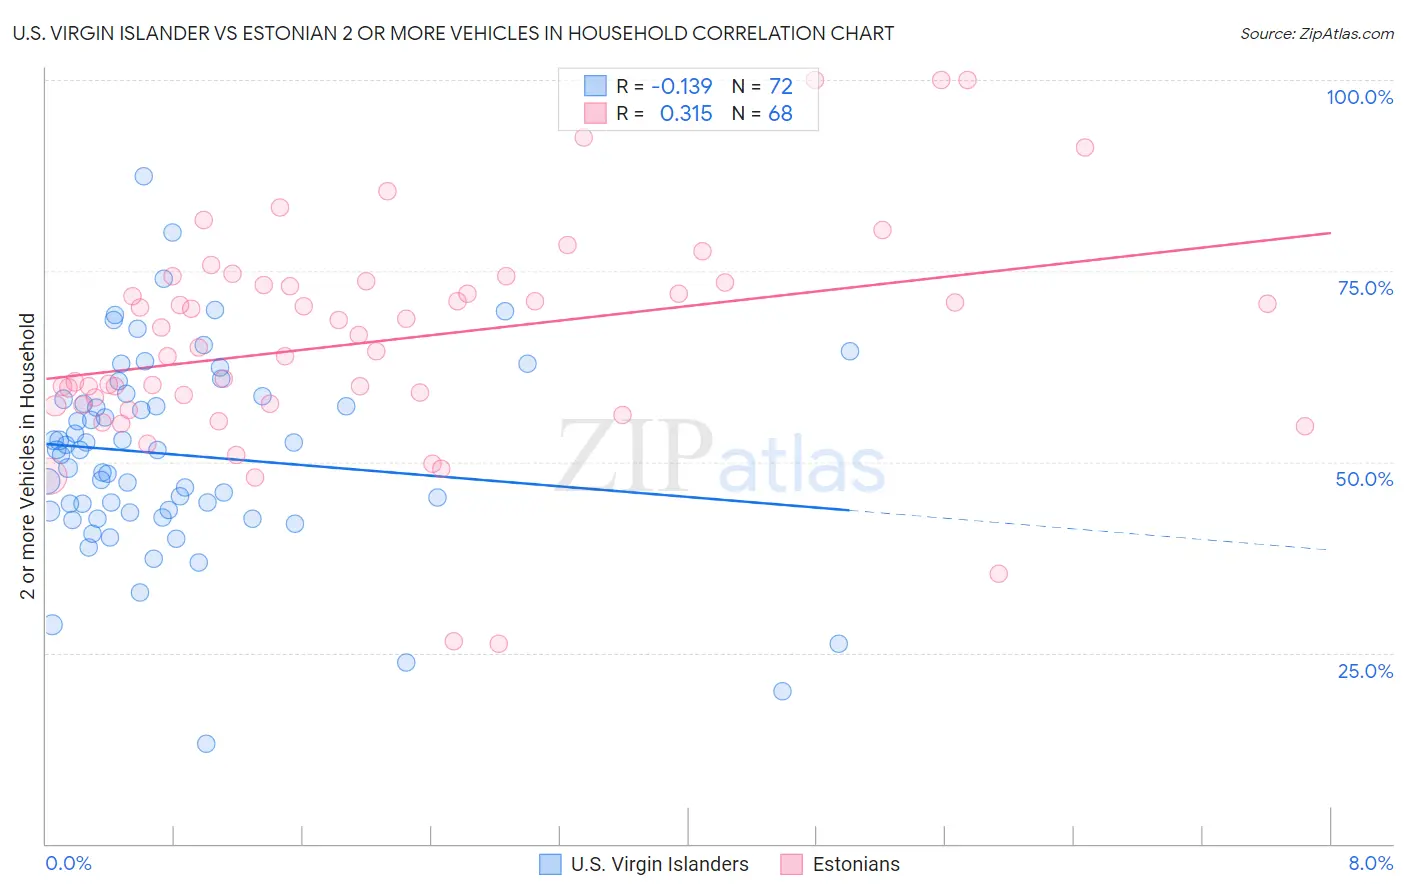
U.S. Virgin Islander vs Estonian 2 or more Vehicles in Household Correlation Chart
The statistical analysis conducted on geographies consisting of 87,429,921 people shows a poor negative correlation between the proportion of U.S. Virgin Islanders and percentage of households with 2 or more vehicles available in the United States with a correlation coefficient (R) of -0.139 and weighted average of 47.5%. Similarly, the statistical analysis conducted on geographies consisting of 123,500,786 people shows a mild positive correlation between the proportion of Estonians and percentage of households with 2 or more vehicles available in the United States with a correlation coefficient (R) of 0.315 and weighted average of 56.6%, a difference of 19.2%.
2 or more Vehicles in Household Correlation Summary
| Measurement | U.S. Virgin Islander | Estonian |
| Minimum | 13.1% | 26.1% |
| Maximum | 87.3% | 100.0% |
| Range | 74.2% | 73.9% |
| Mean | 50.9% | 65.9% |
| Median | 51.5% | 65.7% |
| Interquartile 25% (IQ1) | 43.4% | 57.5% |
| Interquartile 75% (IQ3) | 58.4% | 73.3% |
| Interquartile Range (IQR) | 14.9% | 15.7% |
| Standard Deviation (Sample) | 13.1% | 14.5% |
| Standard Deviation (Population) | 13.0% | 14.4% |
Similar Demographics by 2 or more Vehicles in Household
Demographics Similar to U.S. Virgin Islanders by 2 or more Vehicles in Household
In terms of 2 or more vehicles in household, the demographic groups most similar to U.S. Virgin Islanders are Haitian (47.6%, a difference of 0.17%), Immigrants from Ghana (47.4%, a difference of 0.22%), Puerto Rican (47.1%, a difference of 0.80%), Immigrants from Belarus (47.9%, a difference of 0.91%), and Ghanaian (48.0%, a difference of 1.0%).
| Demographics | Rating | Rank | 2 or more Vehicles in Household |
| Immigrants | Israel | 0.0 /100 | #306 | Tragic 49.2% |
| Hopi | 0.0 /100 | #307 | Tragic 49.0% |
| Albanians | 0.0 /100 | #308 | Tragic 49.0% |
| Moroccans | 0.0 /100 | #309 | Tragic 48.8% |
| Ghanaians | 0.0 /100 | #310 | Tragic 48.0% |
| Immigrants | Belarus | 0.0 /100 | #311 | Tragic 47.9% |
| Haitians | 0.0 /100 | #312 | Tragic 47.6% |
| U.S. Virgin Islanders | 0.0 /100 | #313 | Tragic 47.5% |
| Immigrants | Ghana | 0.0 /100 | #314 | Tragic 47.4% |
| Puerto Ricans | 0.0 /100 | #315 | Tragic 47.1% |
| Cape Verdeans | 0.0 /100 | #316 | Tragic 46.8% |
| Immigrants | Haiti | 0.0 /100 | #317 | Tragic 46.5% |
| Immigrants | Albania | 0.0 /100 | #318 | Tragic 46.0% |
| Jamaicans | 0.0 /100 | #319 | Tragic 45.8% |
| Soviet Union | 0.0 /100 | #320 | Tragic 45.7% |
Demographics Similar to Estonians by 2 or more Vehicles in Household
In terms of 2 or more vehicles in household, the demographic groups most similar to Estonians are Immigrants from Thailand (56.6%, a difference of 0.030%), Immigrants from South Central Asia (56.6%, a difference of 0.050%), Ute (56.6%, a difference of 0.070%), Tsimshian (56.7%, a difference of 0.080%), and New Zealander (56.7%, a difference of 0.10%).
| Demographics | Rating | Rank | 2 or more Vehicles in Household |
| Natives/Alaskans | 95.0 /100 | #119 | Exceptional 57.0% |
| Costa Ricans | 94.7 /100 | #120 | Exceptional 56.9% |
| Sioux | 93.8 /100 | #121 | Exceptional 56.8% |
| Immigrants | South Africa | 92.5 /100 | #122 | Exceptional 56.7% |
| Australians | 91.8 /100 | #123 | Exceptional 56.7% |
| New Zealanders | 91.8 /100 | #124 | Exceptional 56.7% |
| Tsimshian | 91.6 /100 | #125 | Exceptional 56.7% |
| Estonians | 90.9 /100 | #126 | Exceptional 56.6% |
| Immigrants | Thailand | 90.7 /100 | #127 | Exceptional 56.6% |
| Immigrants | South Central Asia | 90.5 /100 | #128 | Exceptional 56.6% |
| Ute | 90.4 /100 | #129 | Exceptional 56.6% |
| Yugoslavians | 90.0 /100 | #130 | Exceptional 56.6% |
| Bulgarians | 89.7 /100 | #131 | Excellent 56.5% |
| Hungarians | 89.1 /100 | #132 | Excellent 56.5% |
| Comanche | 88.4 /100 | #133 | Excellent 56.5% |