Cajun vs Estonian 2 or more Vehicles in Household
COMPARE
Cajun
Estonian
2 or more Vehicles in Household
2 or more Vehicles in Household Comparison
Cajuns
Estonians
57.7%
2 OR MORE VEHICLES IN HOUSEHOLD
98.5/ 100
METRIC RATING
99th/ 347
METRIC RANK
56.6%
2 OR MORE VEHICLES IN HOUSEHOLD
90.9/ 100
METRIC RATING
126th/ 347
METRIC RANK
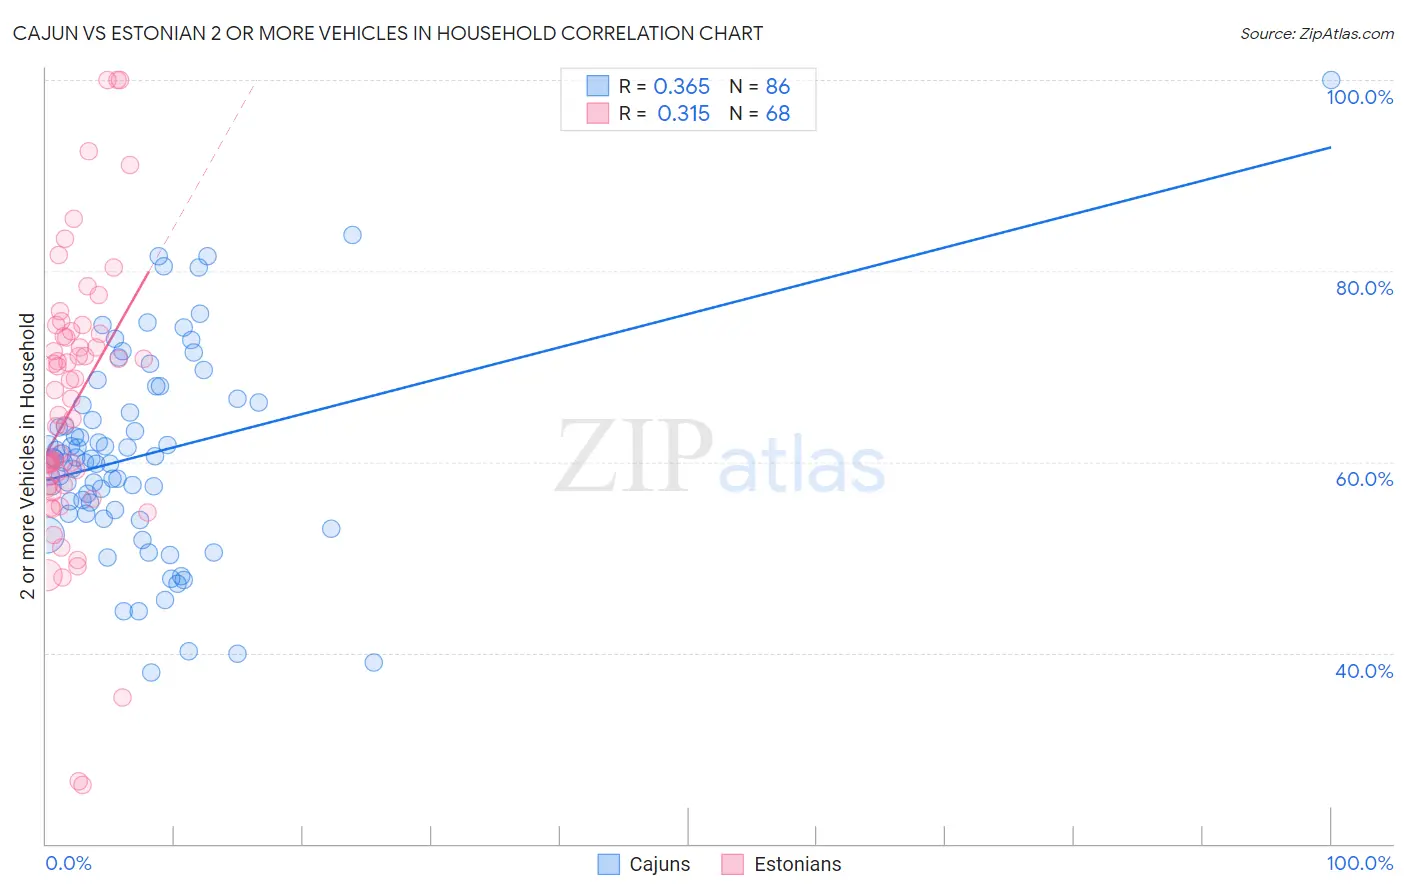
Cajun vs Estonian 2 or more Vehicles in Household Correlation Chart
The statistical analysis conducted on geographies consisting of 149,695,491 people shows a mild positive correlation between the proportion of Cajuns and percentage of households with 2 or more vehicles available in the United States with a correlation coefficient (R) of 0.365 and weighted average of 57.7%. Similarly, the statistical analysis conducted on geographies consisting of 123,500,786 people shows a mild positive correlation between the proportion of Estonians and percentage of households with 2 or more vehicles available in the United States with a correlation coefficient (R) of 0.315 and weighted average of 56.6%, a difference of 1.8%.
2 or more Vehicles in Household Correlation Summary
| Measurement | Cajun | Estonian |
| Minimum | 38.0% | 26.1% |
| Maximum | 100.0% | 100.0% |
| Range | 62.0% | 73.9% |
| Mean | 60.8% | 65.9% |
| Median | 60.3% | 65.7% |
| Interquartile 25% (IQ1) | 54.5% | 57.5% |
| Interquartile 75% (IQ3) | 66.2% | 73.3% |
| Interquartile Range (IQR) | 11.7% | 15.7% |
| Standard Deviation (Sample) | 10.8% | 14.5% |
| Standard Deviation (Population) | 10.7% | 14.4% |
Similar Demographics by 2 or more Vehicles in Household
Demographics Similar to Cajuns by 2 or more Vehicles in Household
In terms of 2 or more vehicles in household, the demographic groups most similar to Cajuns are Palestinian (57.7%, a difference of 0.070%), Fijian (57.6%, a difference of 0.070%), Lebanese (57.6%, a difference of 0.12%), Immigrants from Bolivia (57.6%, a difference of 0.16%), and Jordanian (57.6%, a difference of 0.17%).
| Demographics | Rating | Rank | 2 or more Vehicles in Household |
| Shoshone | 99.0 /100 | #92 | Exceptional 57.9% |
| Ottawa | 99.0 /100 | #93 | Exceptional 57.9% |
| Filipinos | 98.9 /100 | #94 | Exceptional 57.8% |
| Hmong | 98.9 /100 | #95 | Exceptional 57.8% |
| Burmese | 98.8 /100 | #96 | Exceptional 57.8% |
| Slavs | 98.8 /100 | #97 | Exceptional 57.8% |
| Palestinians | 98.6 /100 | #98 | Exceptional 57.7% |
| Cajuns | 98.5 /100 | #99 | Exceptional 57.7% |
| Fijians | 98.4 /100 | #100 | Exceptional 57.6% |
| Lebanese | 98.3 /100 | #101 | Exceptional 57.6% |
| Immigrants | Bolivia | 98.2 /100 | #102 | Exceptional 57.6% |
| Jordanians | 98.2 /100 | #103 | Exceptional 57.6% |
| Immigrants | Indonesia | 98.2 /100 | #104 | Exceptional 57.6% |
| Immigrants | Korea | 98.2 /100 | #105 | Exceptional 57.6% |
| Immigrants | Oceania | 98.2 /100 | #106 | Exceptional 57.5% |
Demographics Similar to Estonians by 2 or more Vehicles in Household
In terms of 2 or more vehicles in household, the demographic groups most similar to Estonians are Immigrants from Thailand (56.6%, a difference of 0.030%), Immigrants from South Central Asia (56.6%, a difference of 0.050%), Ute (56.6%, a difference of 0.070%), Tsimshian (56.7%, a difference of 0.080%), and New Zealander (56.7%, a difference of 0.10%).
| Demographics | Rating | Rank | 2 or more Vehicles in Household |
| Natives/Alaskans | 95.0 /100 | #119 | Exceptional 57.0% |
| Costa Ricans | 94.7 /100 | #120 | Exceptional 56.9% |
| Sioux | 93.8 /100 | #121 | Exceptional 56.8% |
| Immigrants | South Africa | 92.5 /100 | #122 | Exceptional 56.7% |
| Australians | 91.8 /100 | #123 | Exceptional 56.7% |
| New Zealanders | 91.8 /100 | #124 | Exceptional 56.7% |
| Tsimshian | 91.6 /100 | #125 | Exceptional 56.7% |
| Estonians | 90.9 /100 | #126 | Exceptional 56.6% |
| Immigrants | Thailand | 90.7 /100 | #127 | Exceptional 56.6% |
| Immigrants | South Central Asia | 90.5 /100 | #128 | Exceptional 56.6% |
| Ute | 90.4 /100 | #129 | Exceptional 56.6% |
| Yugoslavians | 90.0 /100 | #130 | Exceptional 56.6% |
| Bulgarians | 89.7 /100 | #131 | Excellent 56.5% |
| Hungarians | 89.1 /100 | #132 | Excellent 56.5% |
| Comanche | 88.4 /100 | #133 | Excellent 56.5% |