Guatemalan vs Estonian Householder Income Ages 25 - 44 years
COMPARE
Guatemalan
Estonian
Householder Income Ages 25 - 44 years
Householder Income Ages 25 - 44 years Comparison
Guatemalans
Estonians
$82,331
HOUSEHOLDER INCOME AGES 25 - 44 YEARS
0.1/ 100
METRIC RATING
283rd/ 347
METRIC RANK
$107,269
HOUSEHOLDER INCOME AGES 25 - 44 YEARS
99.9/ 100
METRIC RATING
47th/ 347
METRIC RANK
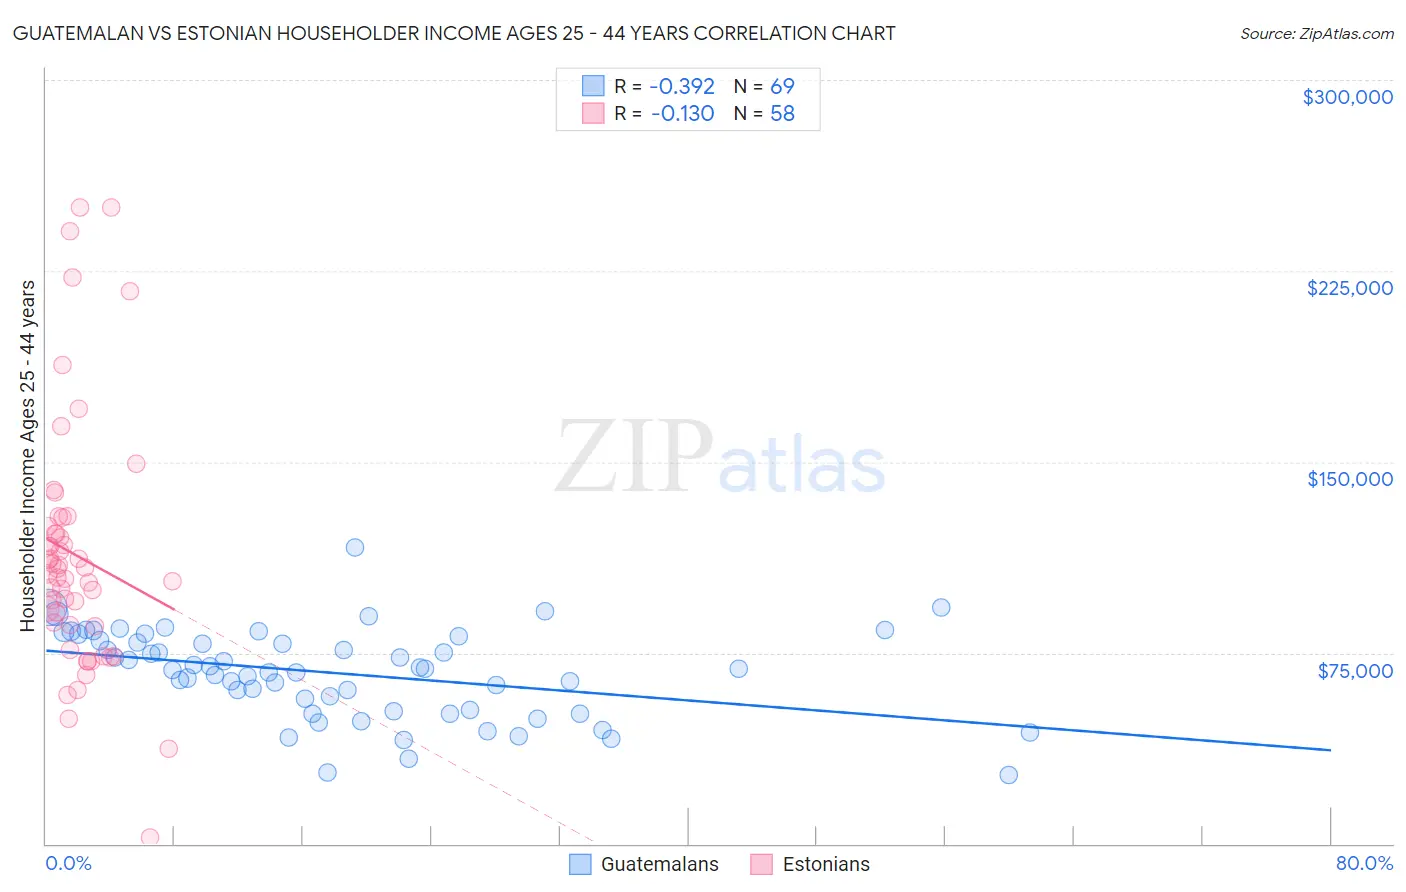
Guatemalan vs Estonian Householder Income Ages 25 - 44 years Correlation Chart
The statistical analysis conducted on geographies consisting of 408,654,214 people shows a mild negative correlation between the proportion of Guatemalans and household income with householder between the ages 25 and 44 in the United States with a correlation coefficient (R) of -0.392 and weighted average of $82,331. Similarly, the statistical analysis conducted on geographies consisting of 123,375,141 people shows a poor negative correlation between the proportion of Estonians and household income with householder between the ages 25 and 44 in the United States with a correlation coefficient (R) of -0.130 and weighted average of $107,269, a difference of 30.3%.
Householder Income Ages 25 - 44 years Correlation Summary
| Measurement | Guatemalan | Estonian |
| Minimum | $26,896 | $2,499 |
| Maximum | $116,391 | $250,001 |
| Range | $89,495 | $247,502 |
| Mean | $66,998 | $113,361 |
| Median | $68,529 | $106,893 |
| Interquartile 25% (IQ1) | $52,170 | $85,980 |
| Interquartile 75% (IQ3) | $80,667 | $124,694 |
| Interquartile Range (IQR) | $28,496 | $38,714 |
| Standard Deviation (Sample) | $17,389 | $49,215 |
| Standard Deviation (Population) | $17,262 | $48,789 |
Similar Demographics by Householder Income Ages 25 - 44 years
Demographics Similar to Guatemalans by Householder Income Ages 25 - 44 years
In terms of householder income ages 25 - 44 years, the demographic groups most similar to Guatemalans are Central American Indian ($82,355, a difference of 0.030%), Cajun ($82,393, a difference of 0.070%), Immigrants from Middle Africa ($82,254, a difference of 0.090%), Immigrants from Somalia ($82,188, a difference of 0.17%), and Ute ($82,166, a difference of 0.20%).
| Demographics | Rating | Rank | Householder Income Ages 25 - 44 years |
| Immigrants | Belize | 0.2 /100 | #276 | Tragic $83,141 |
| Paiute | 0.2 /100 | #277 | Tragic $82,984 |
| Senegalese | 0.2 /100 | #278 | Tragic $82,852 |
| Pima | 0.1 /100 | #279 | Tragic $82,821 |
| Colville | 0.1 /100 | #280 | Tragic $82,604 |
| Cajuns | 0.1 /100 | #281 | Tragic $82,393 |
| Central American Indians | 0.1 /100 | #282 | Tragic $82,355 |
| Guatemalans | 0.1 /100 | #283 | Tragic $82,331 |
| Immigrants | Middle Africa | 0.1 /100 | #284 | Tragic $82,254 |
| Immigrants | Somalia | 0.1 /100 | #285 | Tragic $82,188 |
| Ute | 0.1 /100 | #286 | Tragic $82,166 |
| Immigrants | Latin America | 0.1 /100 | #287 | Tragic $82,166 |
| Comanche | 0.1 /100 | #288 | Tragic $82,152 |
| Shoshone | 0.1 /100 | #289 | Tragic $82,062 |
| Liberians | 0.1 /100 | #290 | Tragic $82,005 |
Demographics Similar to Estonians by Householder Income Ages 25 - 44 years
In terms of householder income ages 25 - 44 years, the demographic groups most similar to Estonians are Bulgarian ($107,264, a difference of 0.010%), Immigrants from Turkey ($107,258, a difference of 0.010%), Cambodian ($107,148, a difference of 0.11%), Immigrants from Belarus ($107,393, a difference of 0.12%), and Israeli ($107,579, a difference of 0.29%).
| Demographics | Rating | Rank | Householder Income Ages 25 - 44 years |
| Immigrants | Lithuania | 99.9 /100 | #40 | Exceptional $108,149 |
| Immigrants | Bolivia | 99.9 /100 | #41 | Exceptional $108,128 |
| Australians | 99.9 /100 | #42 | Exceptional $107,912 |
| Immigrants | Malaysia | 99.9 /100 | #43 | Exceptional $107,650 |
| Immigrants | Indonesia | 99.9 /100 | #44 | Exceptional $107,627 |
| Israelis | 99.9 /100 | #45 | Exceptional $107,579 |
| Immigrants | Belarus | 99.9 /100 | #46 | Exceptional $107,393 |
| Estonians | 99.9 /100 | #47 | Exceptional $107,269 |
| Bulgarians | 99.9 /100 | #48 | Exceptional $107,264 |
| Immigrants | Turkey | 99.9 /100 | #49 | Exceptional $107,258 |
| Cambodians | 99.9 /100 | #50 | Exceptional $107,148 |
| Immigrants | Czechoslovakia | 99.9 /100 | #51 | Exceptional $106,888 |
| Immigrants | Europe | 99.9 /100 | #52 | Exceptional $106,817 |
| Immigrants | Norway | 99.9 /100 | #53 | Exceptional $106,629 |
| Paraguayans | 99.9 /100 | #54 | Exceptional $106,615 |