Guamanian/Chamorro vs Somali Unemployment Among Women with Children Under 6 years
COMPARE
Guamanian/Chamorro
Somali
Unemployment Among Women with Children Under 6 years
Unemployment Among Women with Children Under 6 years Comparison
Guamanians/Chamorros
Somalis
7.8%
UNEMPLOYMENT AMONG WOMEN WITH CHILDREN UNDER 6 YEARS
25.5/ 100
METRIC RATING
200th/ 347
METRIC RANK
6.9%
UNEMPLOYMENT AMONG WOMEN WITH CHILDREN UNDER 6 YEARS
99.7/ 100
METRIC RATING
62nd/ 347
METRIC RANK
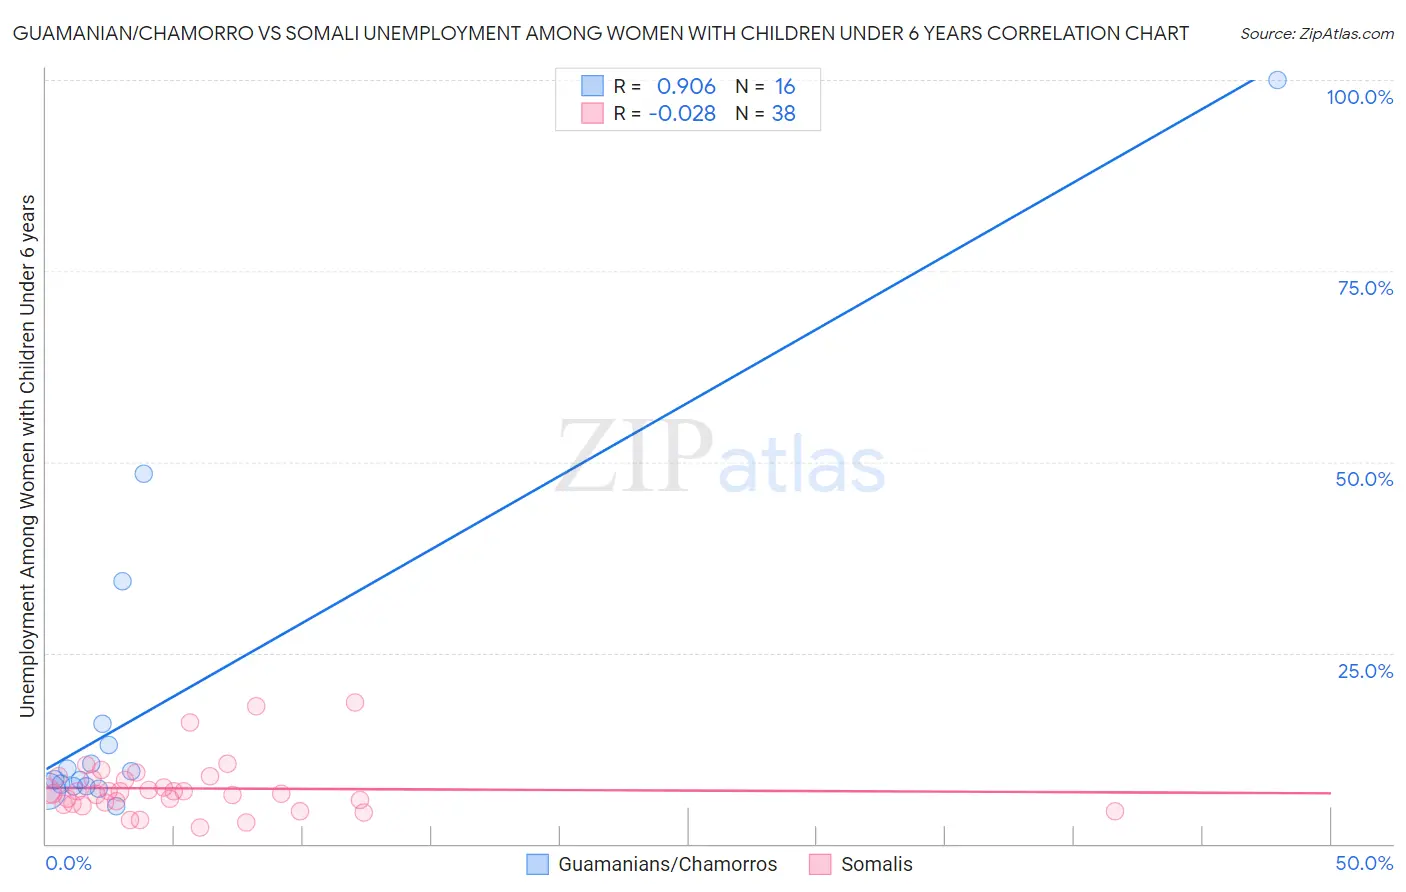
Guamanian/Chamorro vs Somali Unemployment Among Women with Children Under 6 years Correlation Chart
The statistical analysis conducted on geographies consisting of 190,704,537 people shows a near-perfect positive correlation between the proportion of Guamanians/Chamorros and unemployment rate among women with children under the age of 6 in the United States with a correlation coefficient (R) of 0.906 and weighted average of 7.8%. Similarly, the statistical analysis conducted on geographies consisting of 89,780,147 people shows no correlation between the proportion of Somalis and unemployment rate among women with children under the age of 6 in the United States with a correlation coefficient (R) of -0.028 and weighted average of 6.9%, a difference of 12.7%.
Unemployment Among Women with Children Under 6 years Correlation Summary
| Measurement | Guamanian/Chamorro | Somali |
| Minimum | 4.9% | 2.1% |
| Maximum | 100.0% | 18.5% |
| Range | 95.1% | 16.4% |
| Mean | 18.8% | 7.2% |
| Median | 9.0% | 6.7% |
| Interquartile 25% (IQ1) | 7.6% | 5.2% |
| Interquartile 75% (IQ3) | 14.4% | 8.5% |
| Interquartile Range (IQR) | 6.8% | 3.3% |
| Standard Deviation (Sample) | 24.6% | 3.6% |
| Standard Deviation (Population) | 23.8% | 3.6% |
Similar Demographics by Unemployment Among Women with Children Under 6 years
Demographics Similar to Guamanians/Chamorros by Unemployment Among Women with Children Under 6 years
In terms of unemployment among women with children under 6 years, the demographic groups most similar to Guamanians/Chamorros are Basque (7.8%, a difference of 0.070%), Immigrants from Poland (7.8%, a difference of 0.15%), Sudanese (7.8%, a difference of 0.18%), Spaniard (7.8%, a difference of 0.19%), and Lebanese (7.8%, a difference of 0.30%).
| Demographics | Rating | Rank | Unemployment Among Women with Children Under 6 years |
| Slavs | 32.4 /100 | #193 | Fair 7.7% |
| Syrians | 31.9 /100 | #194 | Fair 7.7% |
| Malaysians | 31.1 /100 | #195 | Fair 7.7% |
| Immigrants | St. Vincent and the Grenadines | 31.1 /100 | #196 | Fair 7.7% |
| Italians | 30.4 /100 | #197 | Fair 7.7% |
| Lithuanians | 30.0 /100 | #198 | Fair 7.8% |
| Immigrants | Poland | 27.3 /100 | #199 | Fair 7.8% |
| Guamanians/Chamorros | 25.5 /100 | #200 | Fair 7.8% |
| Basques | 24.7 /100 | #201 | Fair 7.8% |
| Sudanese | 23.5 /100 | #202 | Fair 7.8% |
| Spaniards | 23.3 /100 | #203 | Fair 7.8% |
| Lebanese | 22.2 /100 | #204 | Fair 7.8% |
| Immigrants | Immigrants | 21.4 /100 | #205 | Fair 7.8% |
| Hungarians | 21.2 /100 | #206 | Fair 7.8% |
| Canadians | 20.6 /100 | #207 | Fair 7.8% |
Demographics Similar to Somalis by Unemployment Among Women with Children Under 6 years
In terms of unemployment among women with children under 6 years, the demographic groups most similar to Somalis are Immigrants from France (6.9%, a difference of 0.040%), Maltese (6.9%, a difference of 0.050%), Tongan (6.9%, a difference of 0.15%), Immigrants from Kuwait (6.9%, a difference of 0.29%), and Immigrants from Sri Lanka (6.9%, a difference of 0.41%).
| Demographics | Rating | Rank | Unemployment Among Women with Children Under 6 years |
| Immigrants | Ukraine | 99.8 /100 | #55 | Exceptional 6.8% |
| Immigrants | Ethiopia | 99.8 /100 | #56 | Exceptional 6.9% |
| Icelanders | 99.8 /100 | #57 | Exceptional 6.9% |
| Immigrants | Turkey | 99.8 /100 | #58 | Exceptional 6.9% |
| Immigrants | Serbia | 99.8 /100 | #59 | Exceptional 6.9% |
| Immigrants | Sri Lanka | 99.8 /100 | #60 | Exceptional 6.9% |
| Immigrants | France | 99.7 /100 | #61 | Exceptional 6.9% |
| Somalis | 99.7 /100 | #62 | Exceptional 6.9% |
| Maltese | 99.7 /100 | #63 | Exceptional 6.9% |
| Tongans | 99.7 /100 | #64 | Exceptional 6.9% |
| Immigrants | Kuwait | 99.7 /100 | #65 | Exceptional 6.9% |
| Immigrants | Belgium | 99.6 /100 | #66 | Exceptional 6.9% |
| Immigrants | Netherlands | 99.5 /100 | #67 | Exceptional 7.0% |
| Paraguayans | 99.4 /100 | #68 | Exceptional 7.0% |
| Immigrants | Eritrea | 99.4 /100 | #69 | Exceptional 7.0% |