Guatemalan vs Somali No Vehicles in Household
COMPARE
Guatemalan
Somali
No Vehicles in Household
No Vehicles in Household Comparison
Guatemalans
Somalis
11.0%
NO VEHICLES IN HOUSEHOLD
16.1/ 100
METRIC RATING
204th/ 347
METRIC RANK
11.0%
NO VEHICLES IN HOUSEHOLD
15.9/ 100
METRIC RATING
206th/ 347
METRIC RANK
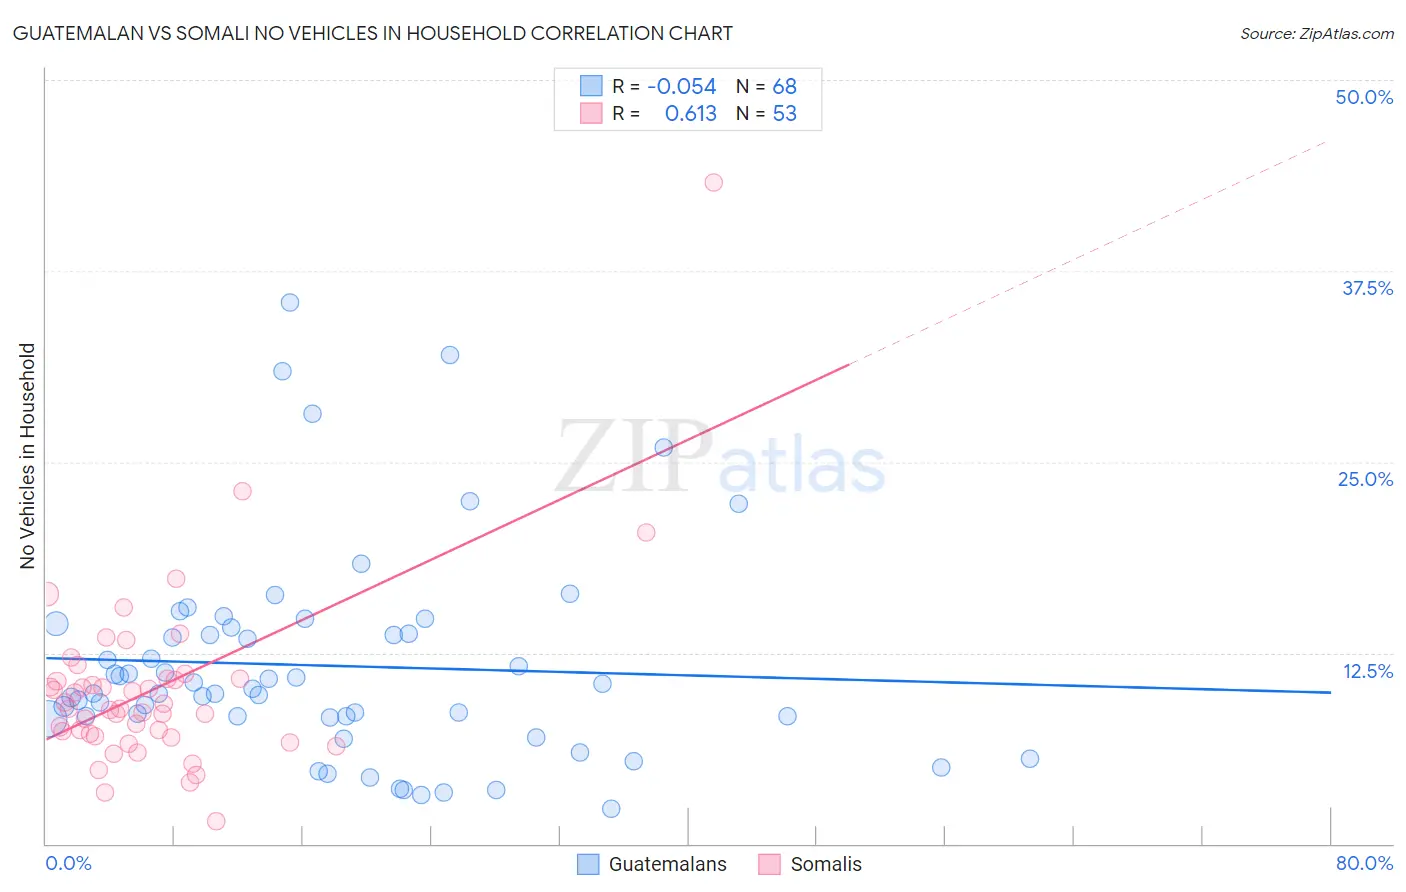
Guatemalan vs Somali No Vehicles in Household Correlation Chart
The statistical analysis conducted on geographies consisting of 408,589,655 people shows a slight negative correlation between the proportion of Guatemalans and percentage of households with no vehicle available in the United States with a correlation coefficient (R) of -0.054 and weighted average of 11.0%. Similarly, the statistical analysis conducted on geographies consisting of 99,232,743 people shows a significant positive correlation between the proportion of Somalis and percentage of households with no vehicle available in the United States with a correlation coefficient (R) of 0.613 and weighted average of 11.0%, a difference of 0.050%.
No Vehicles in Household Correlation Summary
| Measurement | Guatemalan | Somali |
| Minimum | 2.3% | 1.4% |
| Maximum | 35.5% | 43.3% |
| Range | 33.2% | 41.9% |
| Mean | 11.7% | 10.1% |
| Median | 10.0% | 8.8% |
| Interquartile 25% (IQ1) | 8.3% | 7.1% |
| Interquartile 75% (IQ3) | 13.9% | 10.8% |
| Interquartile Range (IQR) | 5.6% | 3.7% |
| Standard Deviation (Sample) | 6.9% | 6.1% |
| Standard Deviation (Population) | 6.8% | 6.0% |
Demographics Similar to Guatemalans and Somalis by No Vehicles in Household
In terms of no vehicles in household, the demographic groups most similar to Guatemalans are Immigrants from Chile (11.0%, a difference of 0.040%), Sierra Leonean (11.0%, a difference of 0.10%), Immigrants from Italy (11.0%, a difference of 0.11%), Pennsylvania German (11.0%, a difference of 0.14%), and Apache (11.0%, a difference of 0.30%). Similarly, the demographic groups most similar to Somalis are Immigrants from Chile (11.0%, a difference of 0.0%), Sierra Leonean (11.0%, a difference of 0.050%), Immigrants from Italy (11.0%, a difference of 0.060%), Pennsylvania German (11.0%, a difference of 0.10%), and Apache (11.0%, a difference of 0.26%).
| Demographics | Rating | Rank | No Vehicles in Household |
| Immigrants | Brazil | 26.3 /100 | #195 | Fair 10.8% |
| Central Americans | 24.3 /100 | #196 | Fair 10.8% |
| Shoshone | 24.1 /100 | #197 | Fair 10.8% |
| Immigrants | Sweden | 22.9 /100 | #198 | Fair 10.8% |
| Immigrants | Asia | 21.3 /100 | #199 | Fair 10.9% |
| Cambodians | 19.6 /100 | #200 | Poor 10.9% |
| Immigrants | Western Europe | 19.1 /100 | #201 | Poor 10.9% |
| Romanians | 17.9 /100 | #202 | Poor 10.9% |
| Iroquois | 17.6 /100 | #203 | Poor 10.9% |
| Guatemalans | 16.1 /100 | #204 | Poor 11.0% |
| Immigrants | Chile | 15.9 /100 | #205 | Poor 11.0% |
| Somalis | 15.9 /100 | #206 | Poor 11.0% |
| Sierra Leoneans | 15.7 /100 | #207 | Poor 11.0% |
| Immigrants | Italy | 15.6 /100 | #208 | Poor 11.0% |
| Pennsylvania Germans | 15.5 /100 | #209 | Poor 11.0% |
| Apache | 14.8 /100 | #210 | Poor 11.0% |
| Crow | 14.2 /100 | #211 | Poor 11.0% |
| Immigrants | Western Asia | 13.9 /100 | #212 | Poor 11.0% |
| Immigrants | Hungary | 12.3 /100 | #213 | Poor 11.1% |
| Immigrants | Denmark | 12.1 /100 | #214 | Poor 11.1% |
| Immigrants | Sri Lanka | 10.6 /100 | #215 | Poor 11.2% |