Assyrian/Chaldean/Syriac vs Somali No Vehicles in Household
COMPARE
Assyrian/Chaldean/Syriac
Somali
No Vehicles in Household
No Vehicles in Household Comparison
Assyrians/Chaldeans/Syriacs
Somalis
7.0%
NO VEHICLES IN HOUSEHOLD
100.0/ 100
METRIC RATING
12th/ 347
METRIC RANK
11.0%
NO VEHICLES IN HOUSEHOLD
15.9/ 100
METRIC RATING
206th/ 347
METRIC RANK
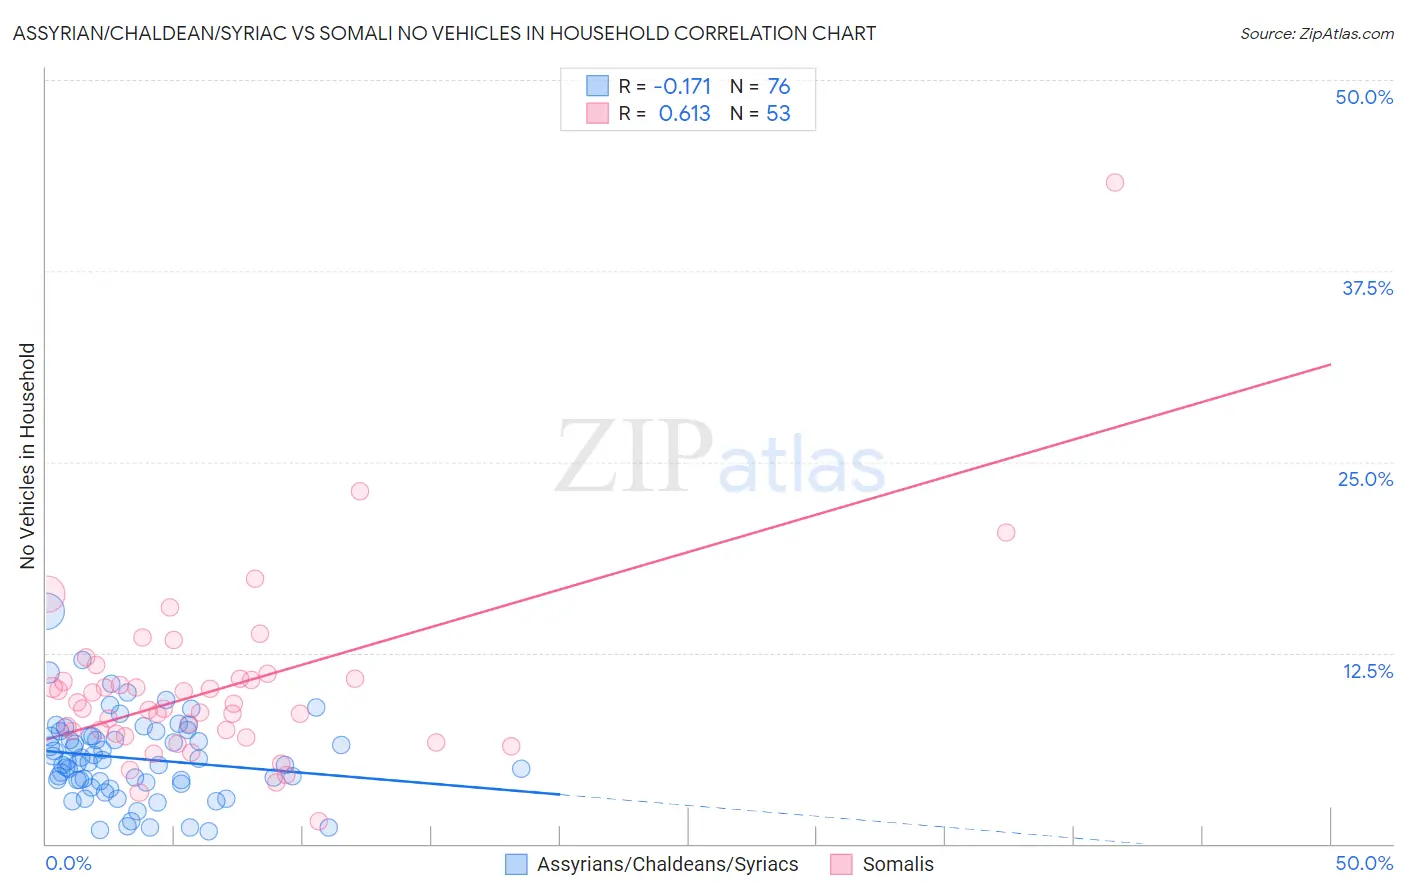
Assyrian/Chaldean/Syriac vs Somali No Vehicles in Household Correlation Chart
The statistical analysis conducted on geographies consisting of 110,265,900 people shows a poor negative correlation between the proportion of Assyrians/Chaldeans/Syriacs and percentage of households with no vehicle available in the United States with a correlation coefficient (R) of -0.171 and weighted average of 7.0%. Similarly, the statistical analysis conducted on geographies consisting of 99,232,743 people shows a significant positive correlation between the proportion of Somalis and percentage of households with no vehicle available in the United States with a correlation coefficient (R) of 0.613 and weighted average of 11.0%, a difference of 57.5%.
No Vehicles in Household Correlation Summary
| Measurement | Assyrian/Chaldean/Syriac | Somali |
| Minimum | 0.78% | 1.4% |
| Maximum | 15.3% | 43.3% |
| Range | 14.5% | 41.9% |
| Mean | 5.6% | 10.1% |
| Median | 5.3% | 8.8% |
| Interquartile 25% (IQ1) | 4.0% | 7.1% |
| Interquartile 75% (IQ3) | 7.0% | 10.8% |
| Interquartile Range (IQR) | 3.0% | 3.7% |
| Standard Deviation (Sample) | 2.7% | 6.1% |
| Standard Deviation (Population) | 2.7% | 6.0% |
Similar Demographics by No Vehicles in Household
Demographics Similar to Assyrians/Chaldeans/Syriacs by No Vehicles in Household
In terms of no vehicles in household, the demographic groups most similar to Assyrians/Chaldeans/Syriacs are Scandinavian (7.0%, a difference of 0.50%), Mexican (7.0%, a difference of 0.67%), White/Caucasian (7.0%, a difference of 0.80%), Czech (6.9%, a difference of 1.4%), and European (7.1%, a difference of 2.0%).
| Demographics | Rating | Rank | No Vehicles in Household |
| Yakama | 100.0 /100 | #5 | Exceptional 6.6% |
| Germans | 100.0 /100 | #6 | Exceptional 6.7% |
| Scottish | 100.0 /100 | #7 | Exceptional 6.8% |
| Swedes | 100.0 /100 | #8 | Exceptional 6.8% |
| Scotch-Irish | 100.0 /100 | #9 | Exceptional 6.8% |
| Dutch | 100.0 /100 | #10 | Exceptional 6.8% |
| Czechs | 100.0 /100 | #11 | Exceptional 6.9% |
| Assyrians/Chaldeans/Syriacs | 100.0 /100 | #12 | Exceptional 7.0% |
| Scandinavians | 100.0 /100 | #13 | Exceptional 7.0% |
| Mexicans | 100.0 /100 | #14 | Exceptional 7.0% |
| Whites/Caucasians | 100.0 /100 | #15 | Exceptional 7.0% |
| Europeans | 100.0 /100 | #16 | Exceptional 7.1% |
| Welsh | 100.0 /100 | #17 | Exceptional 7.2% |
| Tongans | 100.0 /100 | #18 | Exceptional 7.2% |
| Arapaho | 100.0 /100 | #19 | Exceptional 7.4% |
Demographics Similar to Somalis by No Vehicles in Household
In terms of no vehicles in household, the demographic groups most similar to Somalis are Immigrants from Chile (11.0%, a difference of 0.0%), Guatemalan (11.0%, a difference of 0.050%), Sierra Leonean (11.0%, a difference of 0.050%), Immigrants from Italy (11.0%, a difference of 0.060%), and Pennsylvania German (11.0%, a difference of 0.10%).
| Demographics | Rating | Rank | No Vehicles in Household |
| Immigrants | Asia | 21.3 /100 | #199 | Fair 10.9% |
| Cambodians | 19.6 /100 | #200 | Poor 10.9% |
| Immigrants | Western Europe | 19.1 /100 | #201 | Poor 10.9% |
| Romanians | 17.9 /100 | #202 | Poor 10.9% |
| Iroquois | 17.6 /100 | #203 | Poor 10.9% |
| Guatemalans | 16.1 /100 | #204 | Poor 11.0% |
| Immigrants | Chile | 15.9 /100 | #205 | Poor 11.0% |
| Somalis | 15.9 /100 | #206 | Poor 11.0% |
| Sierra Leoneans | 15.7 /100 | #207 | Poor 11.0% |
| Immigrants | Italy | 15.6 /100 | #208 | Poor 11.0% |
| Pennsylvania Germans | 15.5 /100 | #209 | Poor 11.0% |
| Apache | 14.8 /100 | #210 | Poor 11.0% |
| Crow | 14.2 /100 | #211 | Poor 11.0% |
| Immigrants | Western Asia | 13.9 /100 | #212 | Poor 11.0% |
| Immigrants | Hungary | 12.3 /100 | #213 | Poor 11.1% |