Guamanian/Chamorro vs Immigrants from Norway Disability Age Under 5
COMPARE
Guamanian/Chamorro
Immigrants from Norway
Disability Age Under 5
Disability Age Under 5 Comparison
Guamanians/Chamorros
Immigrants from Norway
1.2%
DISABILITY AGE UNDER 5
57.8/ 100
METRIC RATING
171st/ 347
METRIC RANK
1.3%
DISABILITY AGE UNDER 5
31.1/ 100
METRIC RATING
198th/ 347
METRIC RANK
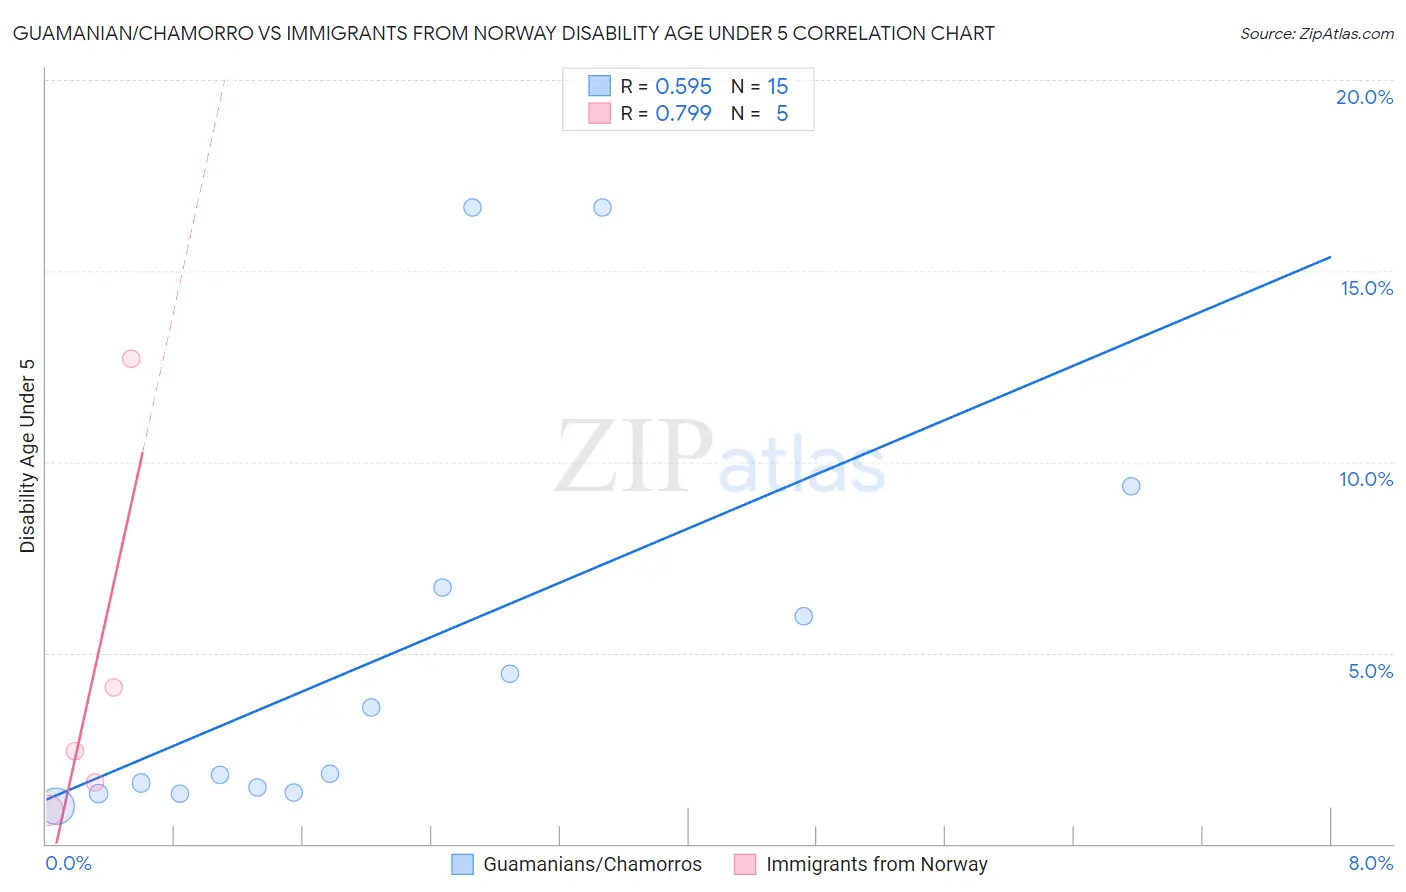
Guamanian/Chamorro vs Immigrants from Norway Disability Age Under 5 Correlation Chart
The statistical analysis conducted on geographies consisting of 149,028,768 people shows a substantial positive correlation between the proportion of Guamanians/Chamorros and percentage of population with a disability under the age of 5 in the United States with a correlation coefficient (R) of 0.595 and weighted average of 1.2%. Similarly, the statistical analysis conducted on geographies consisting of 84,343,493 people shows a strong positive correlation between the proportion of Immigrants from Norway and percentage of population with a disability under the age of 5 in the United States with a correlation coefficient (R) of 0.799 and weighted average of 1.3%, a difference of 2.5%.
Disability Age Under 5 Correlation Summary
| Measurement | Guamanian/Chamorro | Immigrants from Norway |
| Minimum | 0.97% | 0.87% |
| Maximum | 16.7% | 12.7% |
| Range | 15.7% | 11.8% |
| Mean | 5.0% | 4.3% |
| Median | 1.8% | 2.4% |
| Interquartile 25% (IQ1) | 1.4% | 1.2% |
| Interquartile 75% (IQ3) | 6.7% | 8.4% |
| Interquartile Range (IQR) | 5.3% | 7.2% |
| Standard Deviation (Sample) | 5.3% | 4.8% |
| Standard Deviation (Population) | 5.2% | 4.3% |
Similar Demographics by Disability Age Under 5
Demographics Similar to Guamanians/Chamorros by Disability Age Under 5
In terms of disability age under 5, the demographic groups most similar to Guamanians/Chamorros are Immigrants from Jamaica (1.2%, a difference of 0.090%), Immigrants from Uruguay (1.2%, a difference of 0.11%), Sierra Leonean (1.2%, a difference of 0.12%), Immigrants from Argentina (1.2%, a difference of 0.23%), and Immigrants from Central America (1.2%, a difference of 0.34%).
| Demographics | Rating | Rank | Disability Age Under 5 |
| Laotians | 62.8 /100 | #164 | Good 1.2% |
| Immigrants | Kuwait | 62.6 /100 | #165 | Good 1.2% |
| Immigrants | Central America | 61.4 /100 | #166 | Good 1.2% |
| Immigrants | Argentina | 60.2 /100 | #167 | Good 1.2% |
| Sierra Leoneans | 59.1 /100 | #168 | Average 1.2% |
| Immigrants | Uruguay | 59.0 /100 | #169 | Average 1.2% |
| Immigrants | Jamaica | 58.8 /100 | #170 | Average 1.2% |
| Guamanians/Chamorros | 57.8 /100 | #171 | Average 1.2% |
| Crow | 51.0 /100 | #172 | Average 1.2% |
| Immigrants | Ireland | 50.3 /100 | #173 | Average 1.2% |
| Immigrants | Latvia | 50.0 /100 | #174 | Average 1.2% |
| Immigrants | Nigeria | 50.0 /100 | #175 | Average 1.2% |
| Immigrants | Kenya | 48.6 /100 | #176 | Average 1.2% |
| Comanche | 47.5 /100 | #177 | Average 1.2% |
| Venezuelans | 47.1 /100 | #178 | Average 1.2% |
Demographics Similar to Immigrants from Norway by Disability Age Under 5
In terms of disability age under 5, the demographic groups most similar to Immigrants from Norway are Immigrants from Somalia (1.3%, a difference of 0.030%), Immigrants from Belgium (1.3%, a difference of 0.040%), Jamaican (1.3%, a difference of 0.040%), U.S. Virgin Islander (1.3%, a difference of 0.34%), and Immigrants from North Macedonia (1.3%, a difference of 0.37%).
| Demographics | Rating | Rank | Disability Age Under 5 |
| Mexican American Indians | 36.6 /100 | #191 | Fair 1.3% |
| Immigrants | Bosnia and Herzegovina | 36.5 /100 | #192 | Fair 1.3% |
| Immigrants | Sierra Leone | 36.5 /100 | #193 | Fair 1.3% |
| Immigrants | North Macedonia | 34.7 /100 | #194 | Fair 1.3% |
| U.S. Virgin Islanders | 34.4 /100 | #195 | Fair 1.3% |
| Immigrants | Belgium | 31.4 /100 | #196 | Fair 1.3% |
| Immigrants | Somalia | 31.3 /100 | #197 | Fair 1.3% |
| Immigrants | Norway | 31.1 /100 | #198 | Fair 1.3% |
| Jamaicans | 30.7 /100 | #199 | Fair 1.3% |
| Immigrants | Lithuania | 27.2 /100 | #200 | Fair 1.3% |
| Immigrants | Italy | 25.4 /100 | #201 | Fair 1.3% |
| Arapaho | 24.1 /100 | #202 | Fair 1.3% |
| Liberians | 24.0 /100 | #203 | Fair 1.3% |
| Immigrants | Europe | 23.6 /100 | #204 | Fair 1.3% |
| Romanians | 22.5 /100 | #205 | Fair 1.3% |