Immigrants from Senegal vs Immigrants from Norway 4 or more Vehicles in Household
COMPARE
Immigrants from Senegal
Immigrants from Norway
4 or more Vehicles in Household
4 or more Vehicles in Household Comparison
Immigrants from Senegal
Immigrants from Norway
4.2%
4 OR MORE VEHICLES IN HOUSEHOLD
0.0/ 100
METRIC RATING
329th/ 347
METRIC RANK
6.1%
4 OR MORE VEHICLES IN HOUSEHOLD
21.8/ 100
METRIC RATING
199th/ 347
METRIC RANK
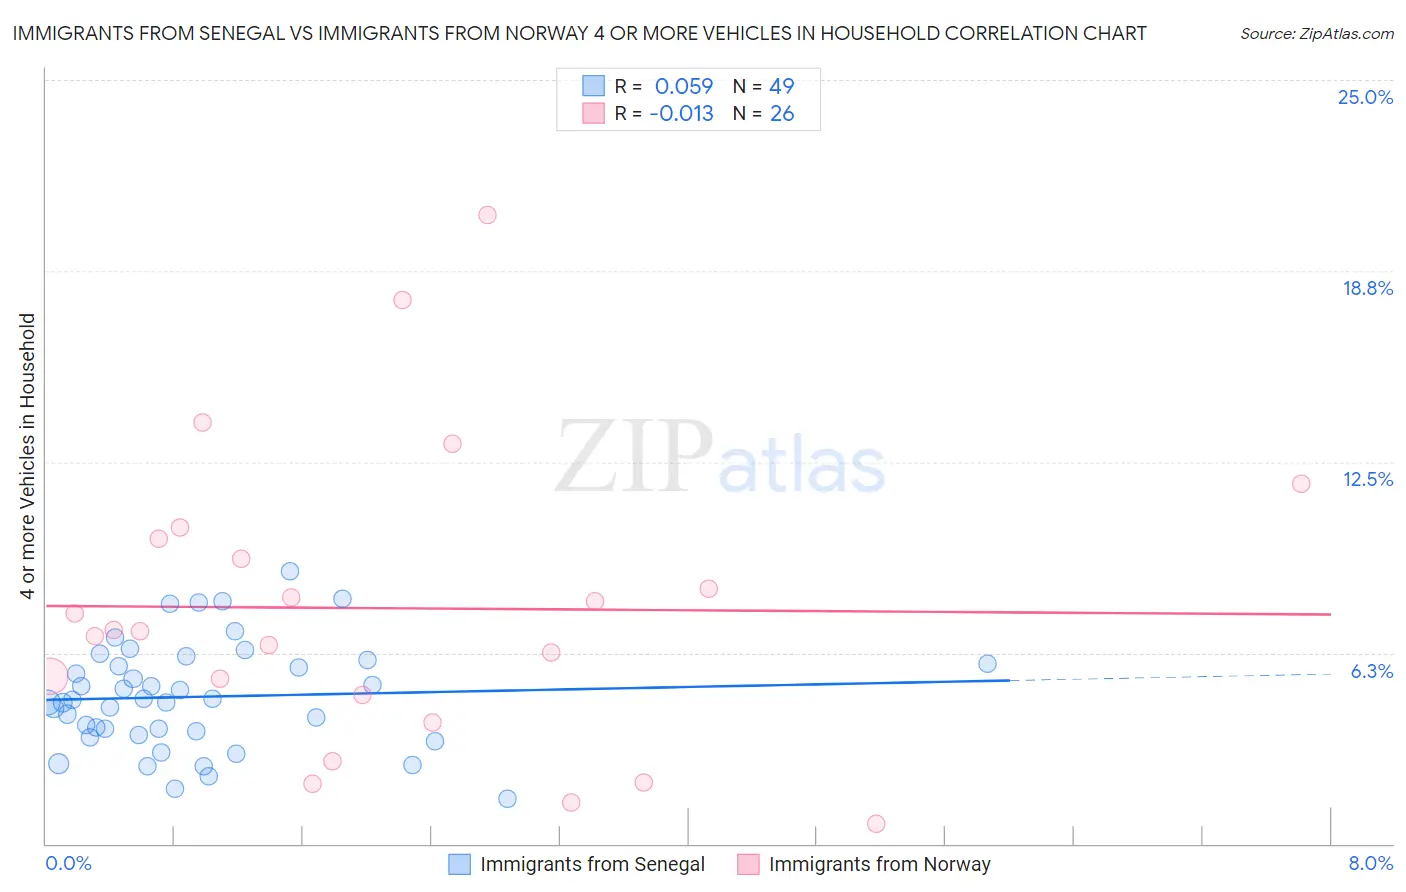
Immigrants from Senegal vs Immigrants from Norway 4 or more Vehicles in Household Correlation Chart
The statistical analysis conducted on geographies consisting of 89,828,164 people shows a slight positive correlation between the proportion of Immigrants from Senegal and percentage of households with 4 or more vehicles available in the United States with a correlation coefficient (R) of 0.059 and weighted average of 4.2%. Similarly, the statistical analysis conducted on geographies consisting of 116,239,195 people shows no correlation between the proportion of Immigrants from Norway and percentage of households with 4 or more vehicles available in the United States with a correlation coefficient (R) of -0.013 and weighted average of 6.1%, a difference of 44.3%.
4 or more Vehicles in Household Correlation Summary
| Measurement | Immigrants from Senegal | Immigrants from Norway |
| Minimum | 1.5% | 0.66% |
| Maximum | 8.9% | 20.6% |
| Range | 7.5% | 19.9% |
| Mean | 4.8% | 7.7% |
| Median | 4.7% | 7.0% |
| Interquartile 25% (IQ1) | 3.6% | 4.9% |
| Interquartile 75% (IQ3) | 6.0% | 10.0% |
| Interquartile Range (IQR) | 2.3% | 5.1% |
| Standard Deviation (Sample) | 1.7% | 4.8% |
| Standard Deviation (Population) | 1.7% | 4.7% |
Similar Demographics by 4 or more Vehicles in Household
Demographics Similar to Immigrants from Senegal by 4 or more Vehicles in Household
In terms of 4 or more vehicles in household, the demographic groups most similar to Immigrants from Senegal are Immigrants from Ecuador (4.2%, a difference of 0.20%), Trinidadian and Tobagonian (4.3%, a difference of 0.27%), West Indian (4.2%, a difference of 0.46%), Immigrants from Dominica (4.2%, a difference of 1.4%), and Senegalese (4.3%, a difference of 1.9%).
| Demographics | Rating | Rank | 4 or more Vehicles in Household |
| Immigrants | Yemen | 0.0 /100 | #322 | Tragic 4.5% |
| Immigrants | Caribbean | 0.0 /100 | #323 | Tragic 4.4% |
| Soviet Union | 0.0 /100 | #324 | Tragic 4.4% |
| Immigrants | Jamaica | 0.0 /100 | #325 | Tragic 4.4% |
| Cape Verdeans | 0.0 /100 | #326 | Tragic 4.4% |
| Senegalese | 0.0 /100 | #327 | Tragic 4.3% |
| Trinidadians and Tobagonians | 0.0 /100 | #328 | Tragic 4.3% |
| Immigrants | Senegal | 0.0 /100 | #329 | Tragic 4.2% |
| Immigrants | Ecuador | 0.0 /100 | #330 | Tragic 4.2% |
| West Indians | 0.0 /100 | #331 | Tragic 4.2% |
| Immigrants | Dominica | 0.0 /100 | #332 | Tragic 4.2% |
| Immigrants | Albania | 0.0 /100 | #333 | Tragic 4.1% |
| Immigrants | Trinidad and Tobago | 0.0 /100 | #334 | Tragic 4.1% |
| Barbadians | 0.0 /100 | #335 | Tragic 3.9% |
| Immigrants | Bangladesh | 0.0 /100 | #336 | Tragic 3.9% |
Demographics Similar to Immigrants from Norway by 4 or more Vehicles in Household
In terms of 4 or more vehicles in household, the demographic groups most similar to Immigrants from Norway are Latvian (6.1%, a difference of 0.0%), Egyptian (6.1%, a difference of 0.060%), Immigrants from South Central Asia (6.1%, a difference of 0.070%), Immigrants from Portugal (6.1%, a difference of 0.080%), and Immigrants from Sierra Leone (6.1%, a difference of 0.20%).
| Demographics | Rating | Rank | 4 or more Vehicles in Household |
| Romanians | 30.7 /100 | #192 | Fair 6.2% |
| Immigrants | Kuwait | 28.0 /100 | #193 | Fair 6.2% |
| Immigrants | Sweden | 27.0 /100 | #194 | Fair 6.2% |
| Argentineans | 27.0 /100 | #195 | Fair 6.2% |
| Tsimshian | 26.4 /100 | #196 | Fair 6.2% |
| Immigrants | Sri Lanka | 23.7 /100 | #197 | Fair 6.1% |
| Immigrants | Portugal | 22.3 /100 | #198 | Fair 6.1% |
| Immigrants | Norway | 21.8 /100 | #199 | Fair 6.1% |
| Latvians | 21.7 /100 | #200 | Fair 6.1% |
| Egyptians | 21.4 /100 | #201 | Fair 6.1% |
| Immigrants | South Central Asia | 21.3 /100 | #202 | Fair 6.1% |
| Immigrants | Sierra Leone | 20.5 /100 | #203 | Fair 6.1% |
| Immigrants | Belize | 19.8 /100 | #204 | Poor 6.1% |
| Hondurans | 19.3 /100 | #205 | Poor 6.1% |
| Kenyans | 18.5 /100 | #206 | Poor 6.1% |