Guamanian/Chamorro vs Immigrants from Norway 1st Grade
COMPARE
Guamanian/Chamorro
Immigrants from Norway
1st Grade
1st Grade Comparison
Guamanians/Chamorros
Immigrants from Norway
97.8%
1ST GRADE
26.2/ 100
METRIC RATING
197th/ 347
METRIC RANK
98.2%
1ST GRADE
96.6/ 100
METRIC RATING
112th/ 347
METRIC RANK
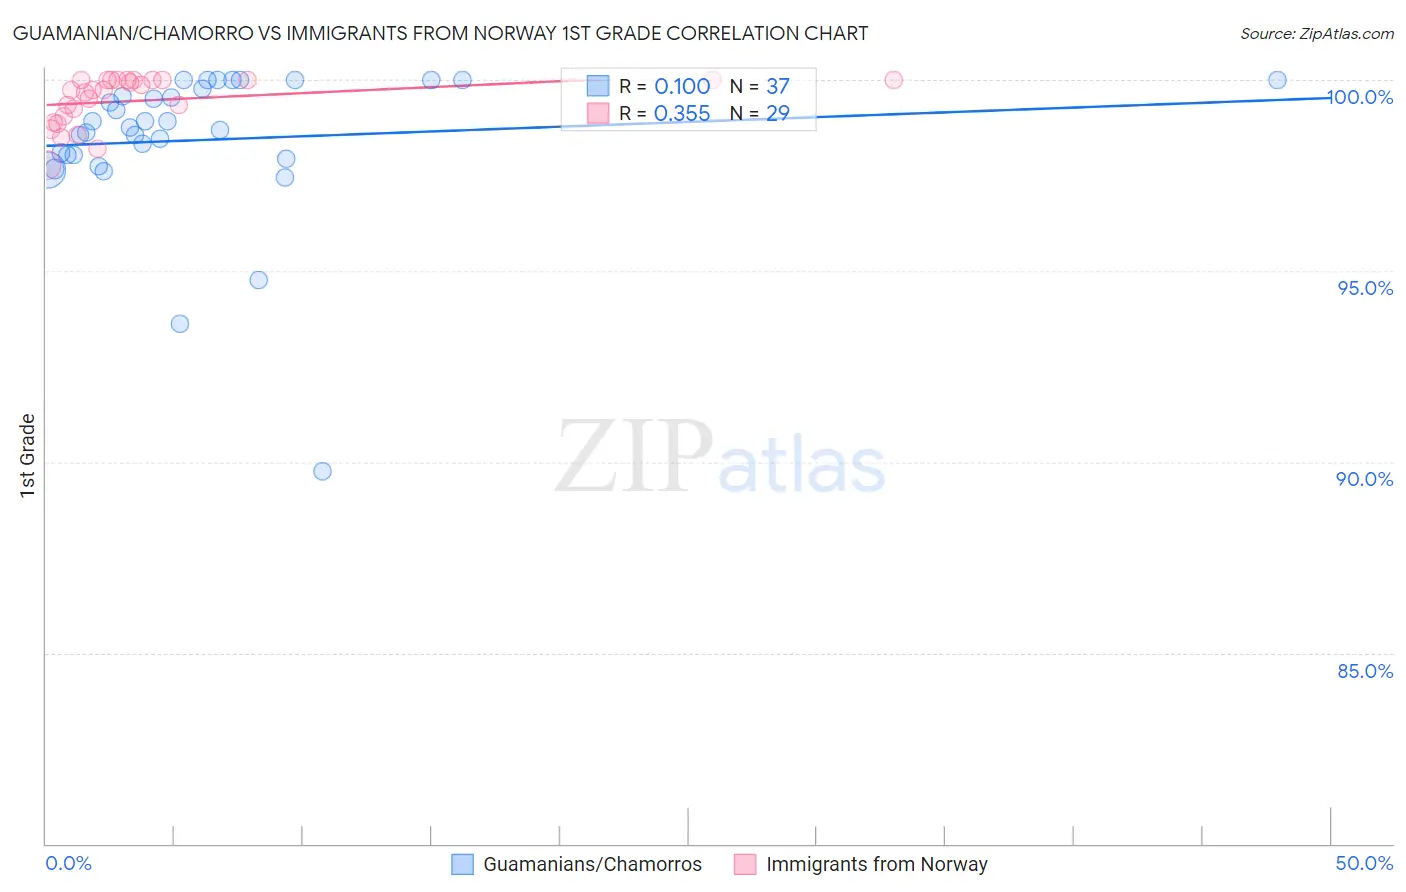
Guamanian/Chamorro vs Immigrants from Norway 1st Grade Correlation Chart
The statistical analysis conducted on geographies consisting of 221,965,618 people shows a slight positive correlation between the proportion of Guamanians/Chamorros and percentage of population with at least 1st grade education in the United States with a correlation coefficient (R) of 0.100 and weighted average of 97.8%. Similarly, the statistical analysis conducted on geographies consisting of 116,716,420 people shows a mild positive correlation between the proportion of Immigrants from Norway and percentage of population with at least 1st grade education in the United States with a correlation coefficient (R) of 0.355 and weighted average of 98.2%, a difference of 0.34%.
1st Grade Correlation Summary
| Measurement | Guamanian/Chamorro | Immigrants from Norway |
| Minimum | 89.7% | 97.8% |
| Maximum | 100.0% | 100.0% |
| Range | 10.3% | 2.2% |
| Mean | 98.4% | 99.5% |
| Median | 98.8% | 99.7% |
| Interquartile 25% (IQ1) | 98.0% | 99.0% |
| Interquartile 75% (IQ3) | 99.9% | 100.0% |
| Interquartile Range (IQR) | 1.9% | 1.0% |
| Standard Deviation (Sample) | 2.0% | 0.64% |
| Standard Deviation (Population) | 2.0% | 0.63% |
Similar Demographics by 1st Grade
Demographics Similar to Guamanians/Chamorros by 1st Grade
In terms of 1st grade, the demographic groups most similar to Guamanians/Chamorros are Immigrants from Kenya (97.8%, a difference of 0.0%), Immigrants from Taiwan (97.9%, a difference of 0.010%), Mongolian (97.9%, a difference of 0.010%), Hawaiian (97.9%, a difference of 0.010%), and Yuman (97.8%, a difference of 0.010%).
| Demographics | Rating | Rank | 1st Grade |
| Panamanians | 34.1 /100 | #190 | Fair 97.9% |
| Blacks/African Americans | 30.7 /100 | #191 | Fair 97.9% |
| Paraguayans | 30.2 /100 | #192 | Fair 97.9% |
| Immigrants | Taiwan | 29.4 /100 | #193 | Fair 97.9% |
| Mongolians | 29.2 /100 | #194 | Fair 97.9% |
| Hawaiians | 28.8 /100 | #195 | Fair 97.9% |
| Immigrants | Kenya | 26.3 /100 | #196 | Fair 97.8% |
| Guamanians/Chamorros | 26.2 /100 | #197 | Fair 97.8% |
| Yuman | 24.4 /100 | #198 | Fair 97.8% |
| Tohono O'odham | 23.2 /100 | #199 | Fair 97.8% |
| Immigrants | Egypt | 22.6 /100 | #200 | Fair 97.8% |
| Immigrants | Lebanon | 20.1 /100 | #201 | Fair 97.8% |
| Immigrants | Ukraine | 19.2 /100 | #202 | Poor 97.8% |
| Immigrants | Southern Europe | 18.2 /100 | #203 | Poor 97.8% |
| Immigrants | Uganda | 18.2 /100 | #204 | Poor 97.8% |
Demographics Similar to Immigrants from Norway by 1st Grade
In terms of 1st grade, the demographic groups most similar to Immigrants from Norway are Immigrants from Singapore (98.2%, a difference of 0.0%), Immigrants from Czechoslovakia (98.2%, a difference of 0.0%), Immigrants from Latvia (98.2%, a difference of 0.0%), German Russian (98.2%, a difference of 0.010%), and Ute (98.2%, a difference of 0.010%).
| Demographics | Rating | Rank | 1st Grade |
| Basques | 97.4 /100 | #105 | Exceptional 98.2% |
| Turks | 97.4 /100 | #106 | Exceptional 98.2% |
| Immigrants | Switzerland | 97.3 /100 | #107 | Exceptional 98.2% |
| Bhutanese | 97.3 /100 | #108 | Exceptional 98.2% |
| German Russians | 97.1 /100 | #109 | Exceptional 98.2% |
| Immigrants | Singapore | 96.7 /100 | #110 | Exceptional 98.2% |
| Immigrants | Czechoslovakia | 96.6 /100 | #111 | Exceptional 98.2% |
| Immigrants | Norway | 96.6 /100 | #112 | Exceptional 98.2% |
| Immigrants | Latvia | 96.4 /100 | #113 | Exceptional 98.2% |
| Ute | 96.2 /100 | #114 | Exceptional 98.2% |
| Iranians | 96.0 /100 | #115 | Exceptional 98.2% |
| Spanish | 95.9 /100 | #116 | Exceptional 98.2% |
| Yugoslavians | 95.5 /100 | #117 | Exceptional 98.2% |
| Immigrants | France | 95.5 /100 | #118 | Exceptional 98.2% |
| Thais | 94.7 /100 | #119 | Exceptional 98.1% |