Immigrants from England vs Immigrants from Norway 4 or more Vehicles in Household
COMPARE
Immigrants from England
Immigrants from Norway
4 or more Vehicles in Household
4 or more Vehicles in Household Comparison
Immigrants from England
Immigrants from Norway
6.7%
4 OR MORE VEHICLES IN HOUSEHOLD
92.0/ 100
METRIC RATING
129th/ 347
METRIC RANK
6.1%
4 OR MORE VEHICLES IN HOUSEHOLD
21.8/ 100
METRIC RATING
199th/ 347
METRIC RANK
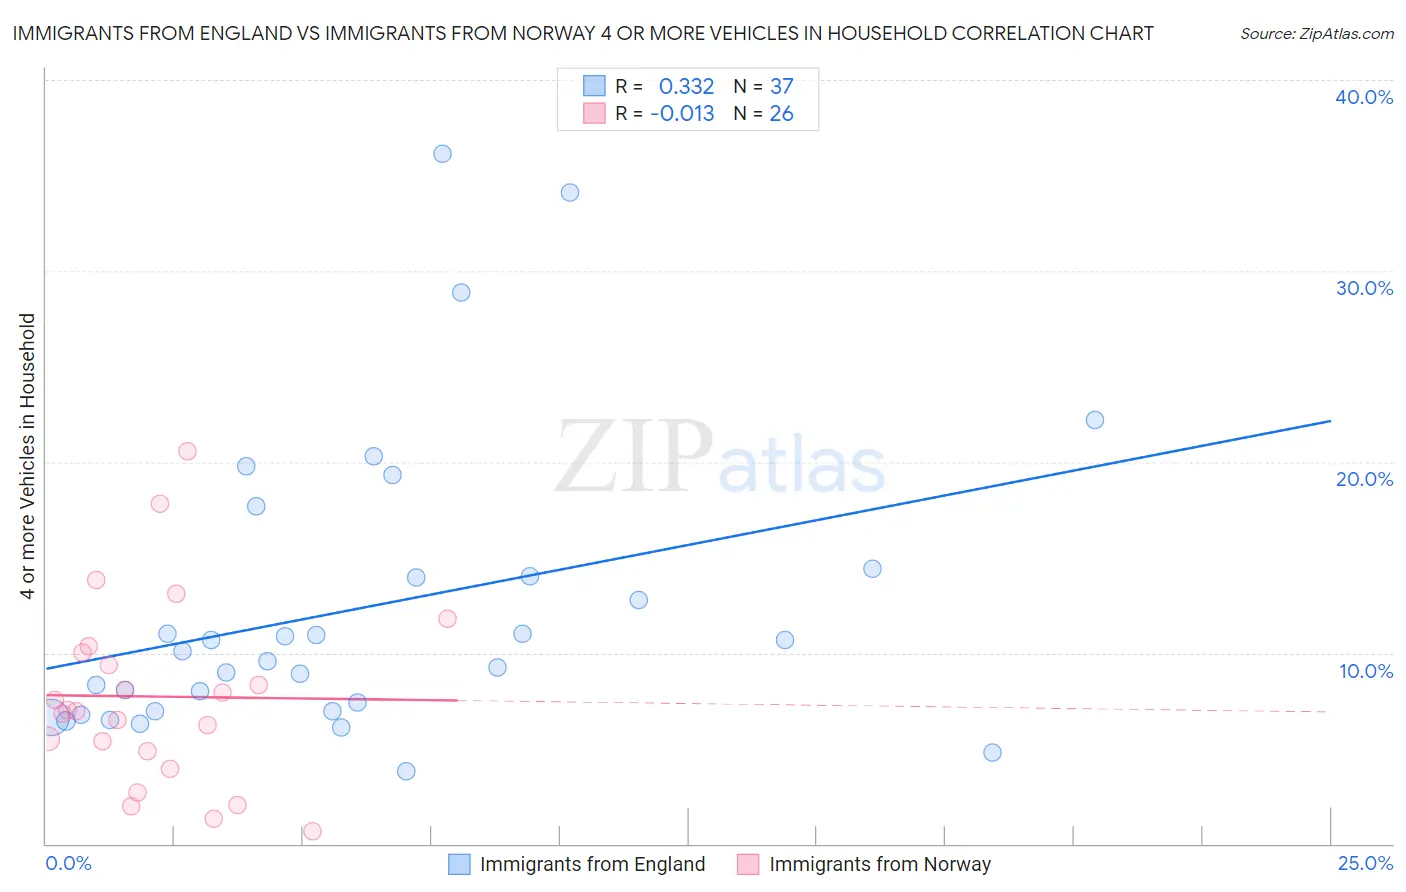
Immigrants from England vs Immigrants from Norway 4 or more Vehicles in Household Correlation Chart
The statistical analysis conducted on geographies consisting of 390,499,867 people shows a mild positive correlation between the proportion of Immigrants from England and percentage of households with 4 or more vehicles available in the United States with a correlation coefficient (R) of 0.332 and weighted average of 6.7%. Similarly, the statistical analysis conducted on geographies consisting of 116,239,195 people shows no correlation between the proportion of Immigrants from Norway and percentage of households with 4 or more vehicles available in the United States with a correlation coefficient (R) of -0.013 and weighted average of 6.1%, a difference of 9.7%.
4 or more Vehicles in Household Correlation Summary
| Measurement | Immigrants from England | Immigrants from Norway |
| Minimum | 3.8% | 0.66% |
| Maximum | 36.2% | 20.6% |
| Range | 32.3% | 19.9% |
| Mean | 12.4% | 7.7% |
| Median | 10.1% | 7.0% |
| Interquartile 25% (IQ1) | 6.9% | 4.9% |
| Interquartile 75% (IQ3) | 14.2% | 10.0% |
| Interquartile Range (IQR) | 7.3% | 5.1% |
| Standard Deviation (Sample) | 7.7% | 4.8% |
| Standard Deviation (Population) | 7.6% | 4.7% |
Similar Demographics by 4 or more Vehicles in Household
Demographics Similar to Immigrants from England by 4 or more Vehicles in Household
In terms of 4 or more vehicles in household, the demographic groups most similar to Immigrants from England are Immigrants from Bolivia (6.7%, a difference of 0.16%), Immigrants from Korea (6.8%, a difference of 0.66%), Austrian (6.8%, a difference of 0.79%), Belgian (6.8%, a difference of 0.79%), and Immigrants from Scotland (6.7%, a difference of 0.83%).
| Demographics | Rating | Rank | 4 or more Vehicles in Household |
| Immigrants | Nicaragua | 94.7 /100 | #122 | Exceptional 6.8% |
| Immigrants | Immigrants | 94.6 /100 | #123 | Exceptional 6.8% |
| Immigrants | Asia | 94.4 /100 | #124 | Exceptional 6.8% |
| Austrians | 94.1 /100 | #125 | Exceptional 6.8% |
| Belgians | 94.1 /100 | #126 | Exceptional 6.8% |
| Immigrants | Korea | 93.8 /100 | #127 | Exceptional 6.8% |
| Immigrants | Bolivia | 92.5 /100 | #128 | Exceptional 6.7% |
| Immigrants | England | 92.0 /100 | #129 | Exceptional 6.7% |
| Immigrants | Scotland | 89.0 /100 | #130 | Excellent 6.7% |
| Maltese | 88.4 /100 | #131 | Excellent 6.7% |
| Immigrants | Netherlands | 87.8 /100 | #132 | Excellent 6.6% |
| Armenians | 86.9 /100 | #133 | Excellent 6.6% |
| Ottawa | 86.9 /100 | #134 | Excellent 6.6% |
| Tohono O'odham | 86.7 /100 | #135 | Excellent 6.6% |
| Luxembourgers | 86.4 /100 | #136 | Excellent 6.6% |
Demographics Similar to Immigrants from Norway by 4 or more Vehicles in Household
In terms of 4 or more vehicles in household, the demographic groups most similar to Immigrants from Norway are Latvian (6.1%, a difference of 0.0%), Egyptian (6.1%, a difference of 0.060%), Immigrants from South Central Asia (6.1%, a difference of 0.070%), Immigrants from Portugal (6.1%, a difference of 0.080%), and Immigrants from Sierra Leone (6.1%, a difference of 0.20%).
| Demographics | Rating | Rank | 4 or more Vehicles in Household |
| Romanians | 30.7 /100 | #192 | Fair 6.2% |
| Immigrants | Kuwait | 28.0 /100 | #193 | Fair 6.2% |
| Immigrants | Sweden | 27.0 /100 | #194 | Fair 6.2% |
| Argentineans | 27.0 /100 | #195 | Fair 6.2% |
| Tsimshian | 26.4 /100 | #196 | Fair 6.2% |
| Immigrants | Sri Lanka | 23.7 /100 | #197 | Fair 6.1% |
| Immigrants | Portugal | 22.3 /100 | #198 | Fair 6.1% |
| Immigrants | Norway | 21.8 /100 | #199 | Fair 6.1% |
| Latvians | 21.7 /100 | #200 | Fair 6.1% |
| Egyptians | 21.4 /100 | #201 | Fair 6.1% |
| Immigrants | South Central Asia | 21.3 /100 | #202 | Fair 6.1% |
| Immigrants | Sierra Leone | 20.5 /100 | #203 | Fair 6.1% |
| Immigrants | Belize | 19.8 /100 | #204 | Poor 6.1% |
| Hondurans | 19.3 /100 | #205 | Poor 6.1% |
| Kenyans | 18.5 /100 | #206 | Poor 6.1% |